
数据可视化
10种图例
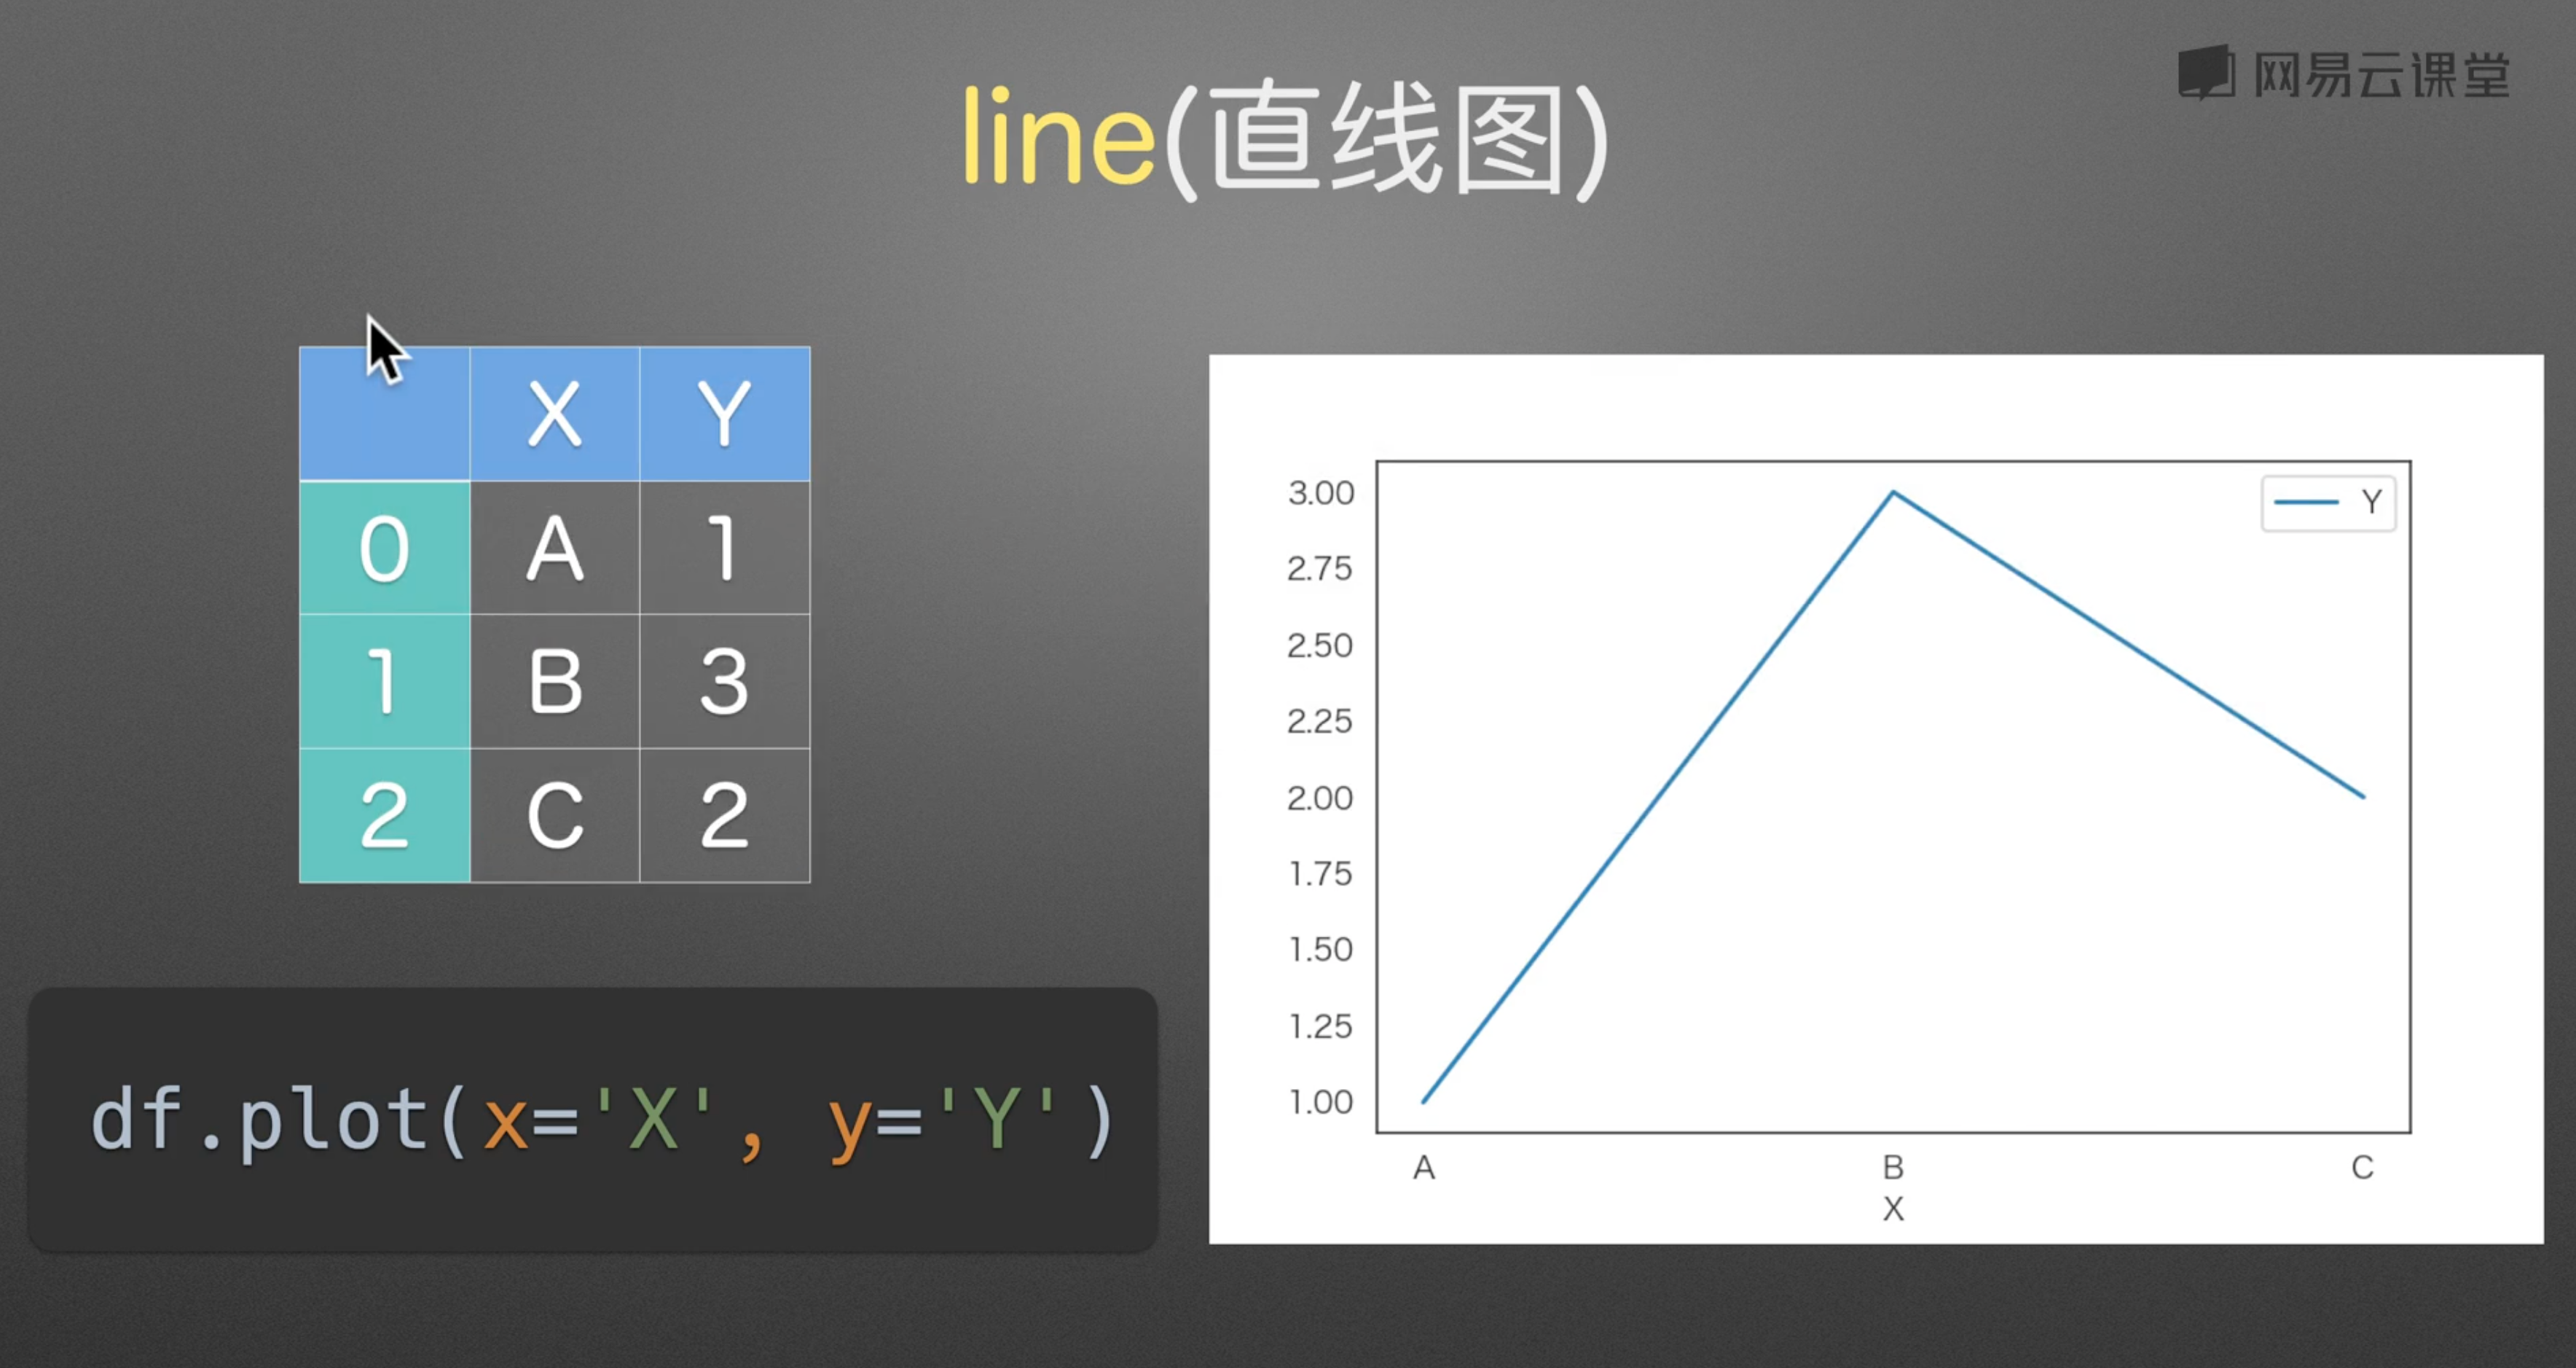
1. 直线图
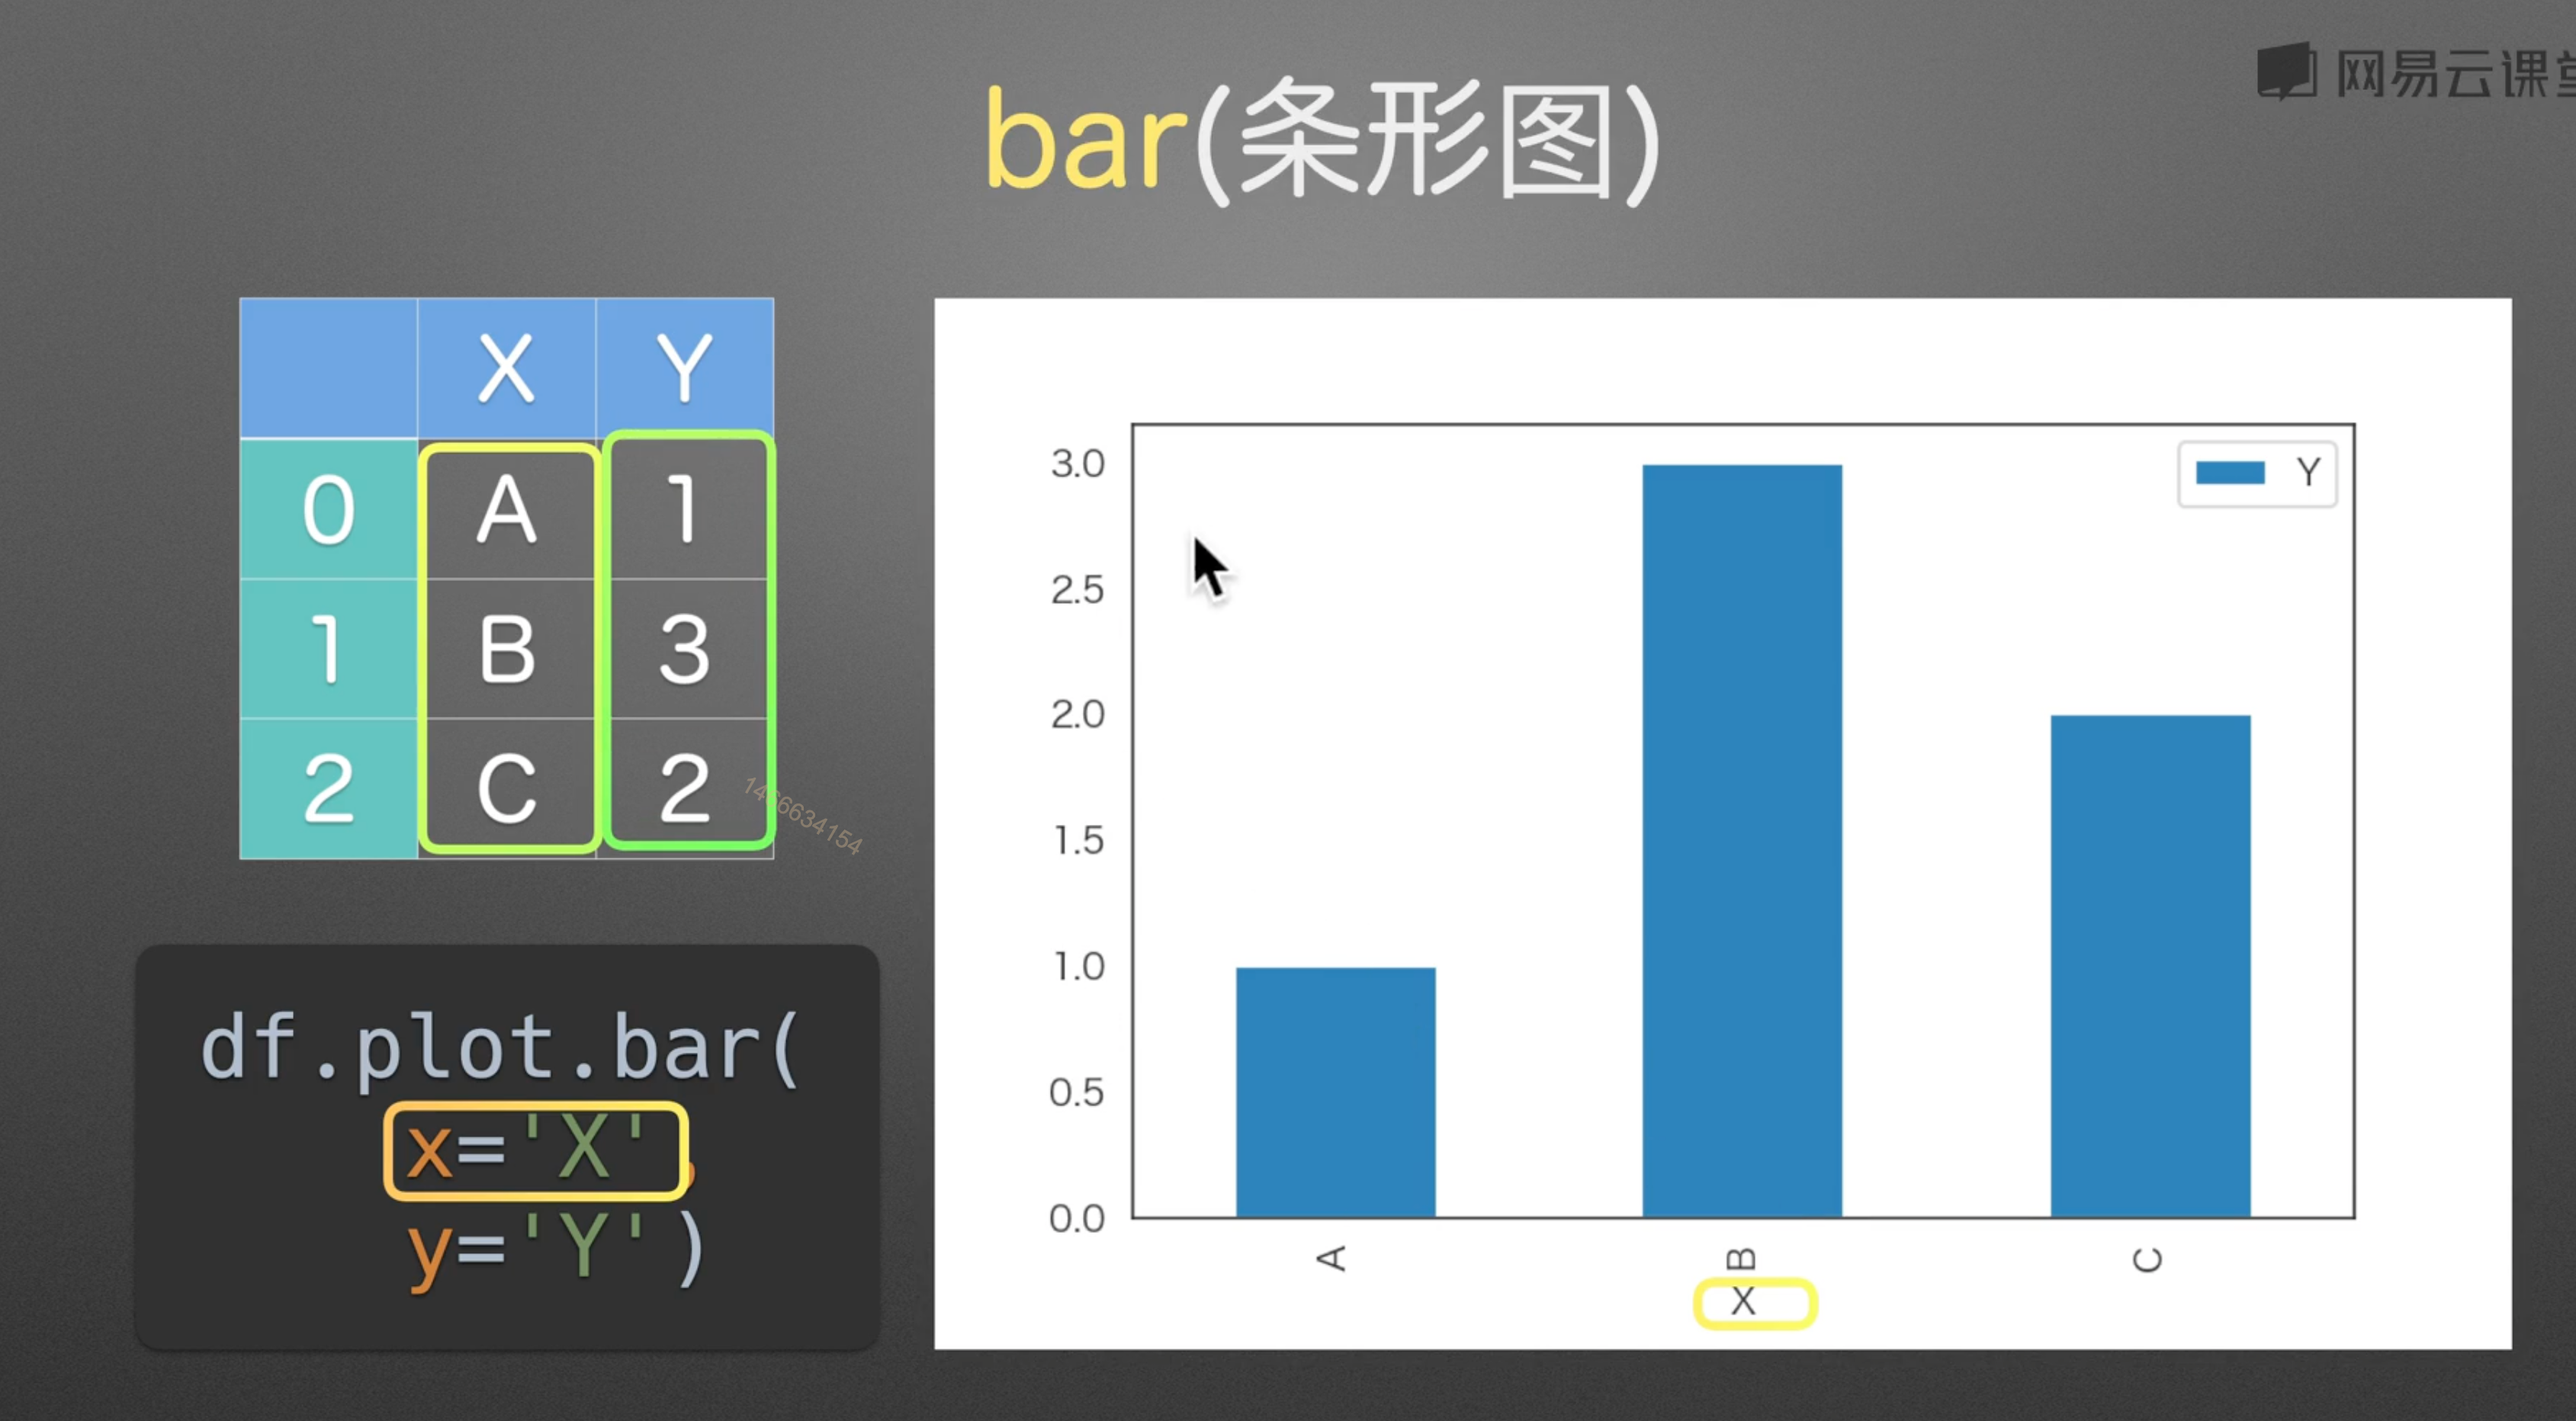
2. 条形图
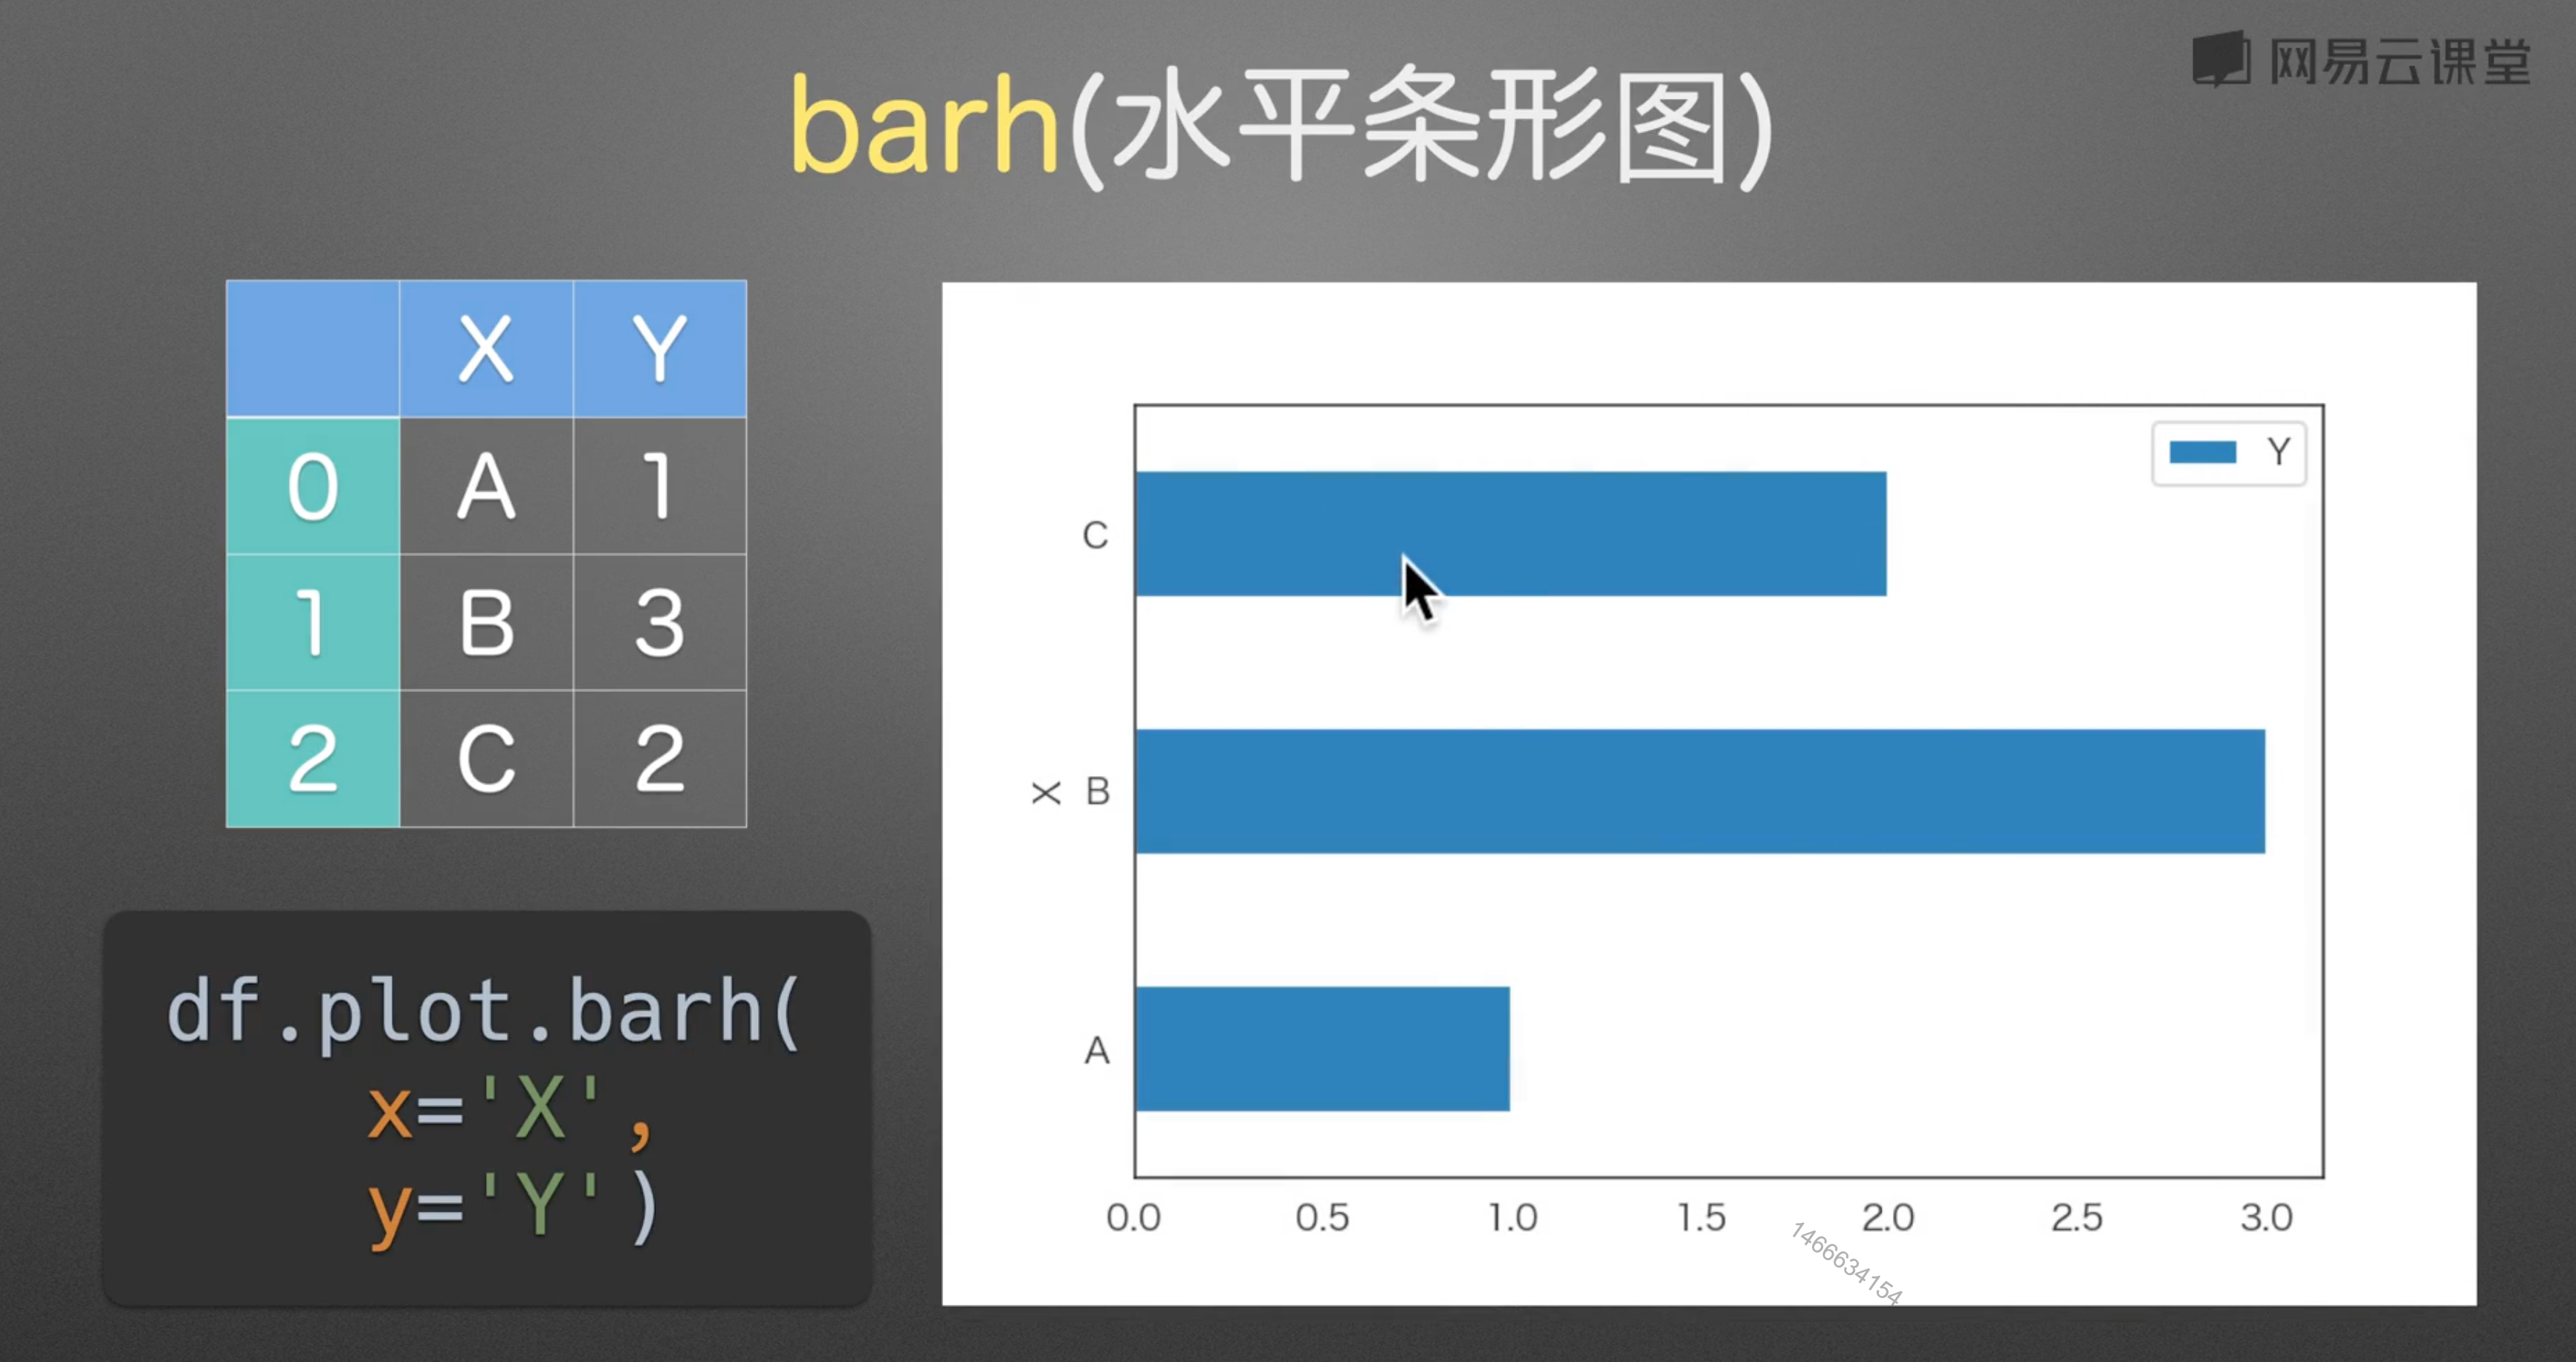
3. 水平条形图
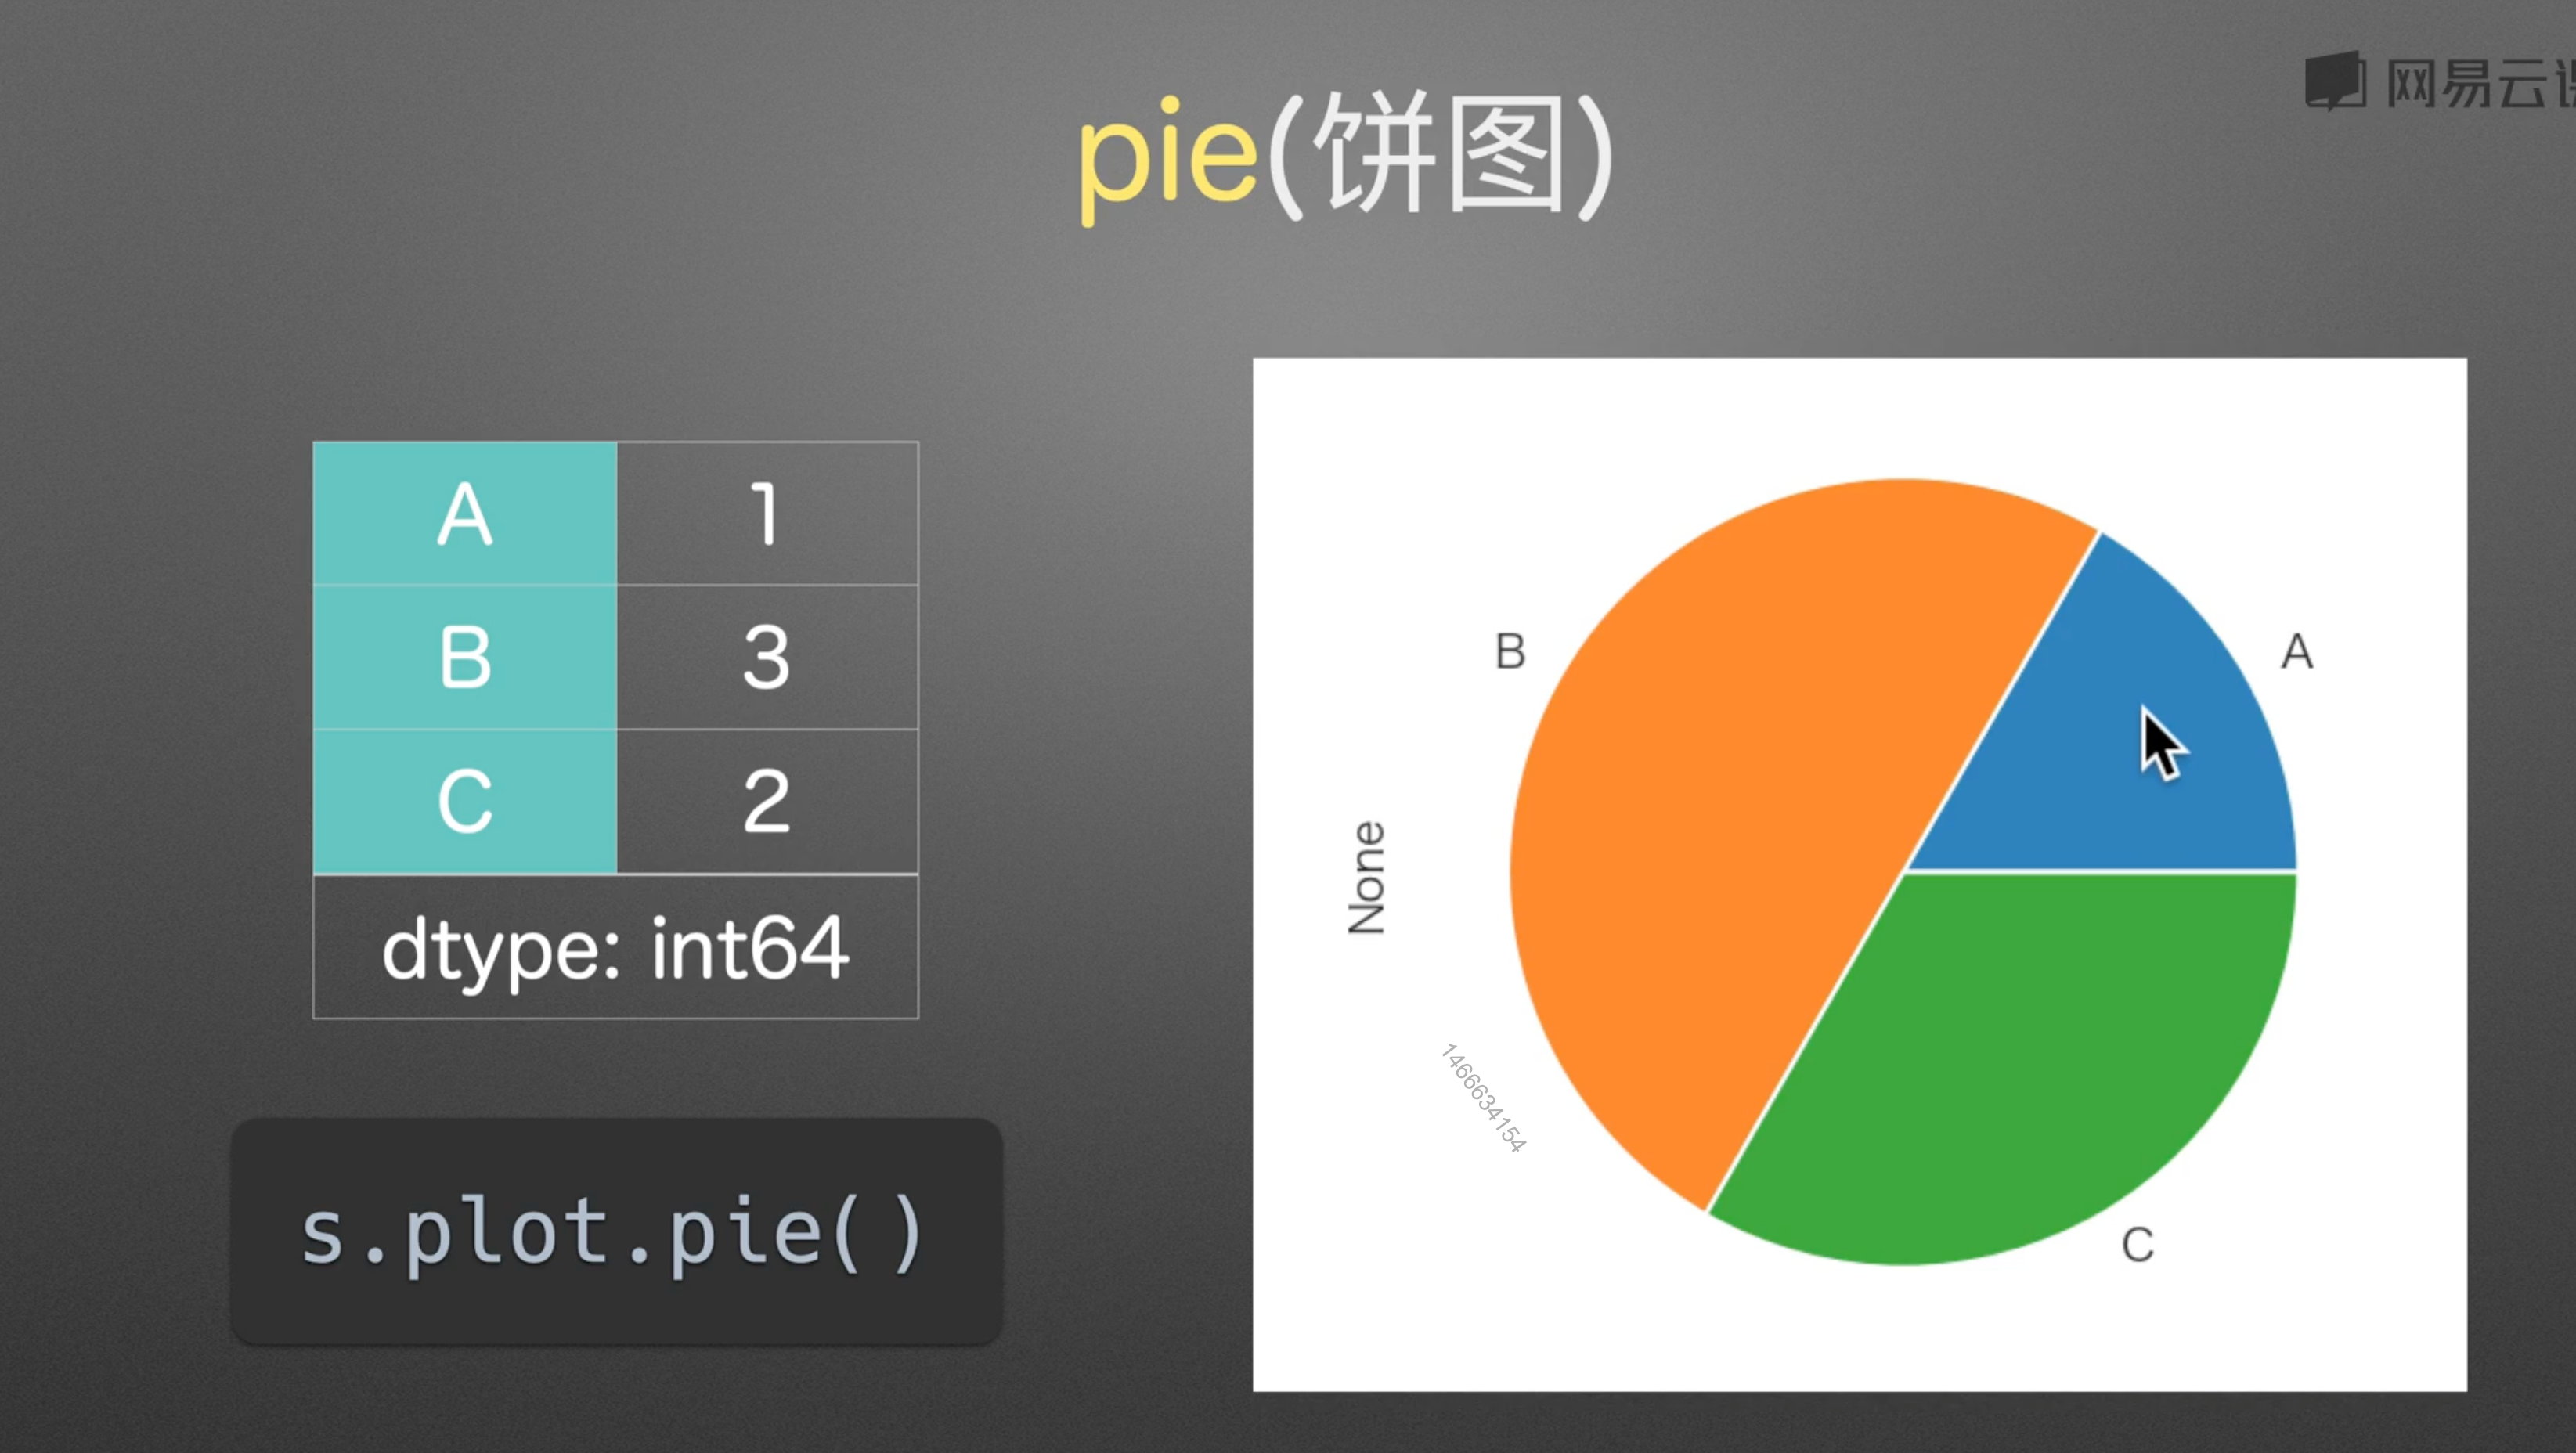
4. 饼图
5. 散点图
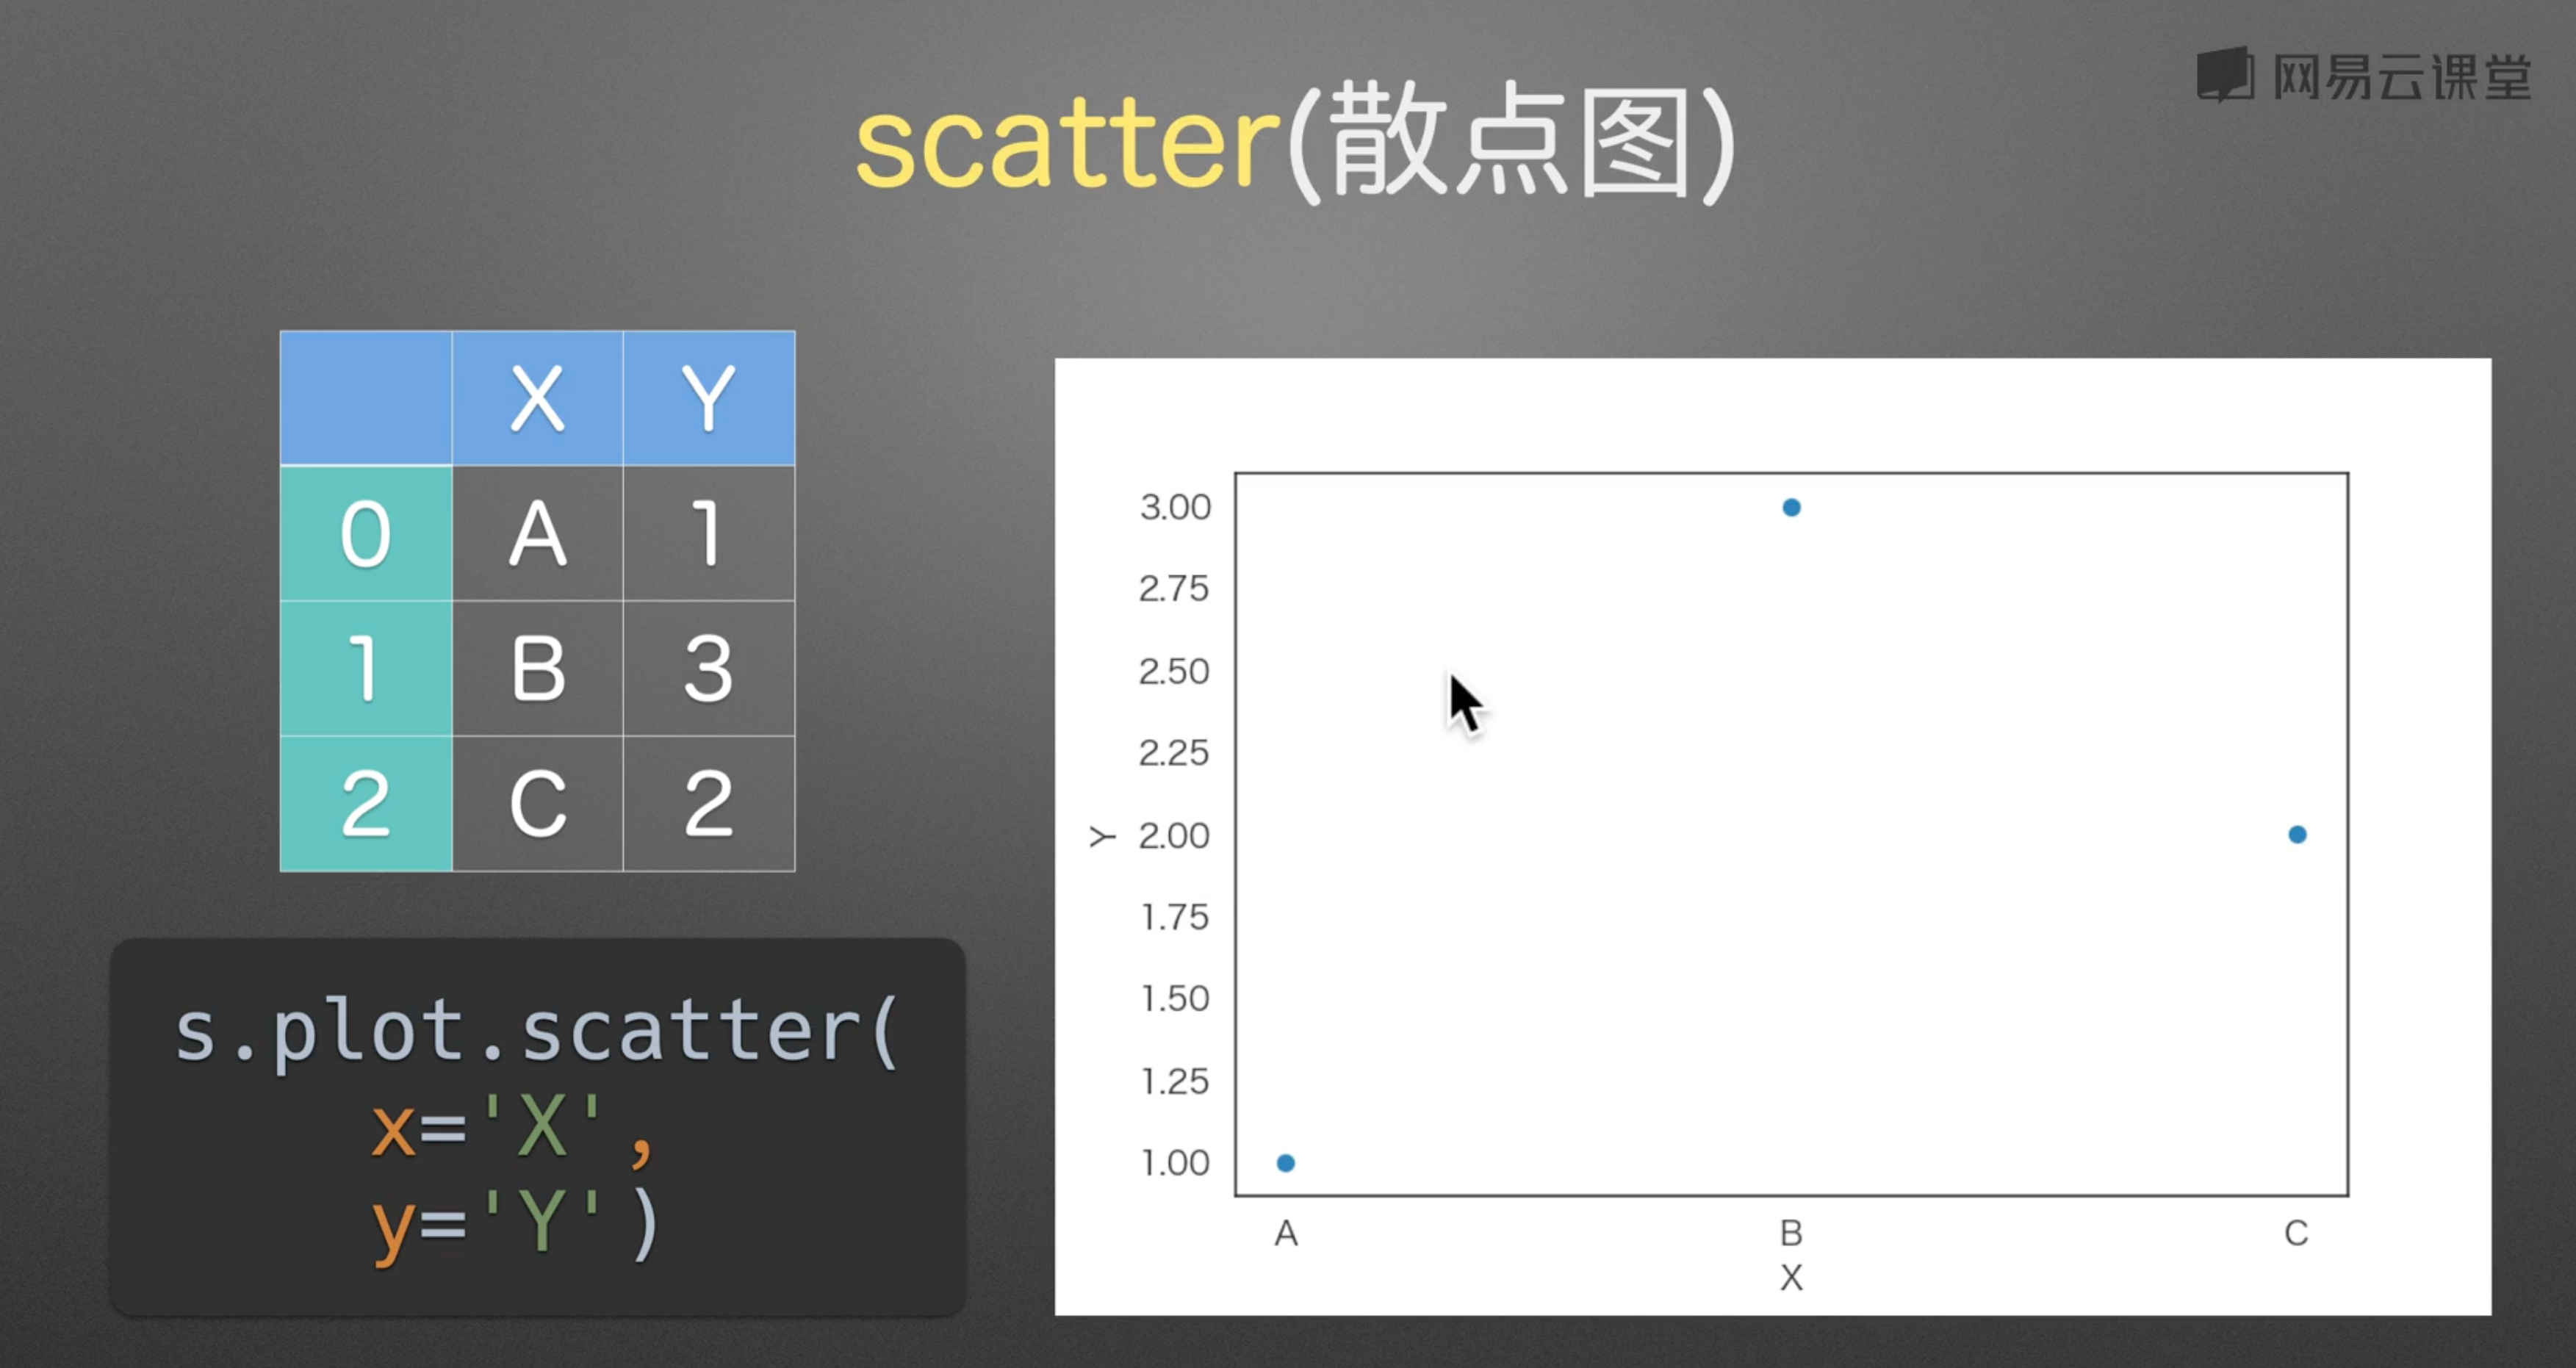
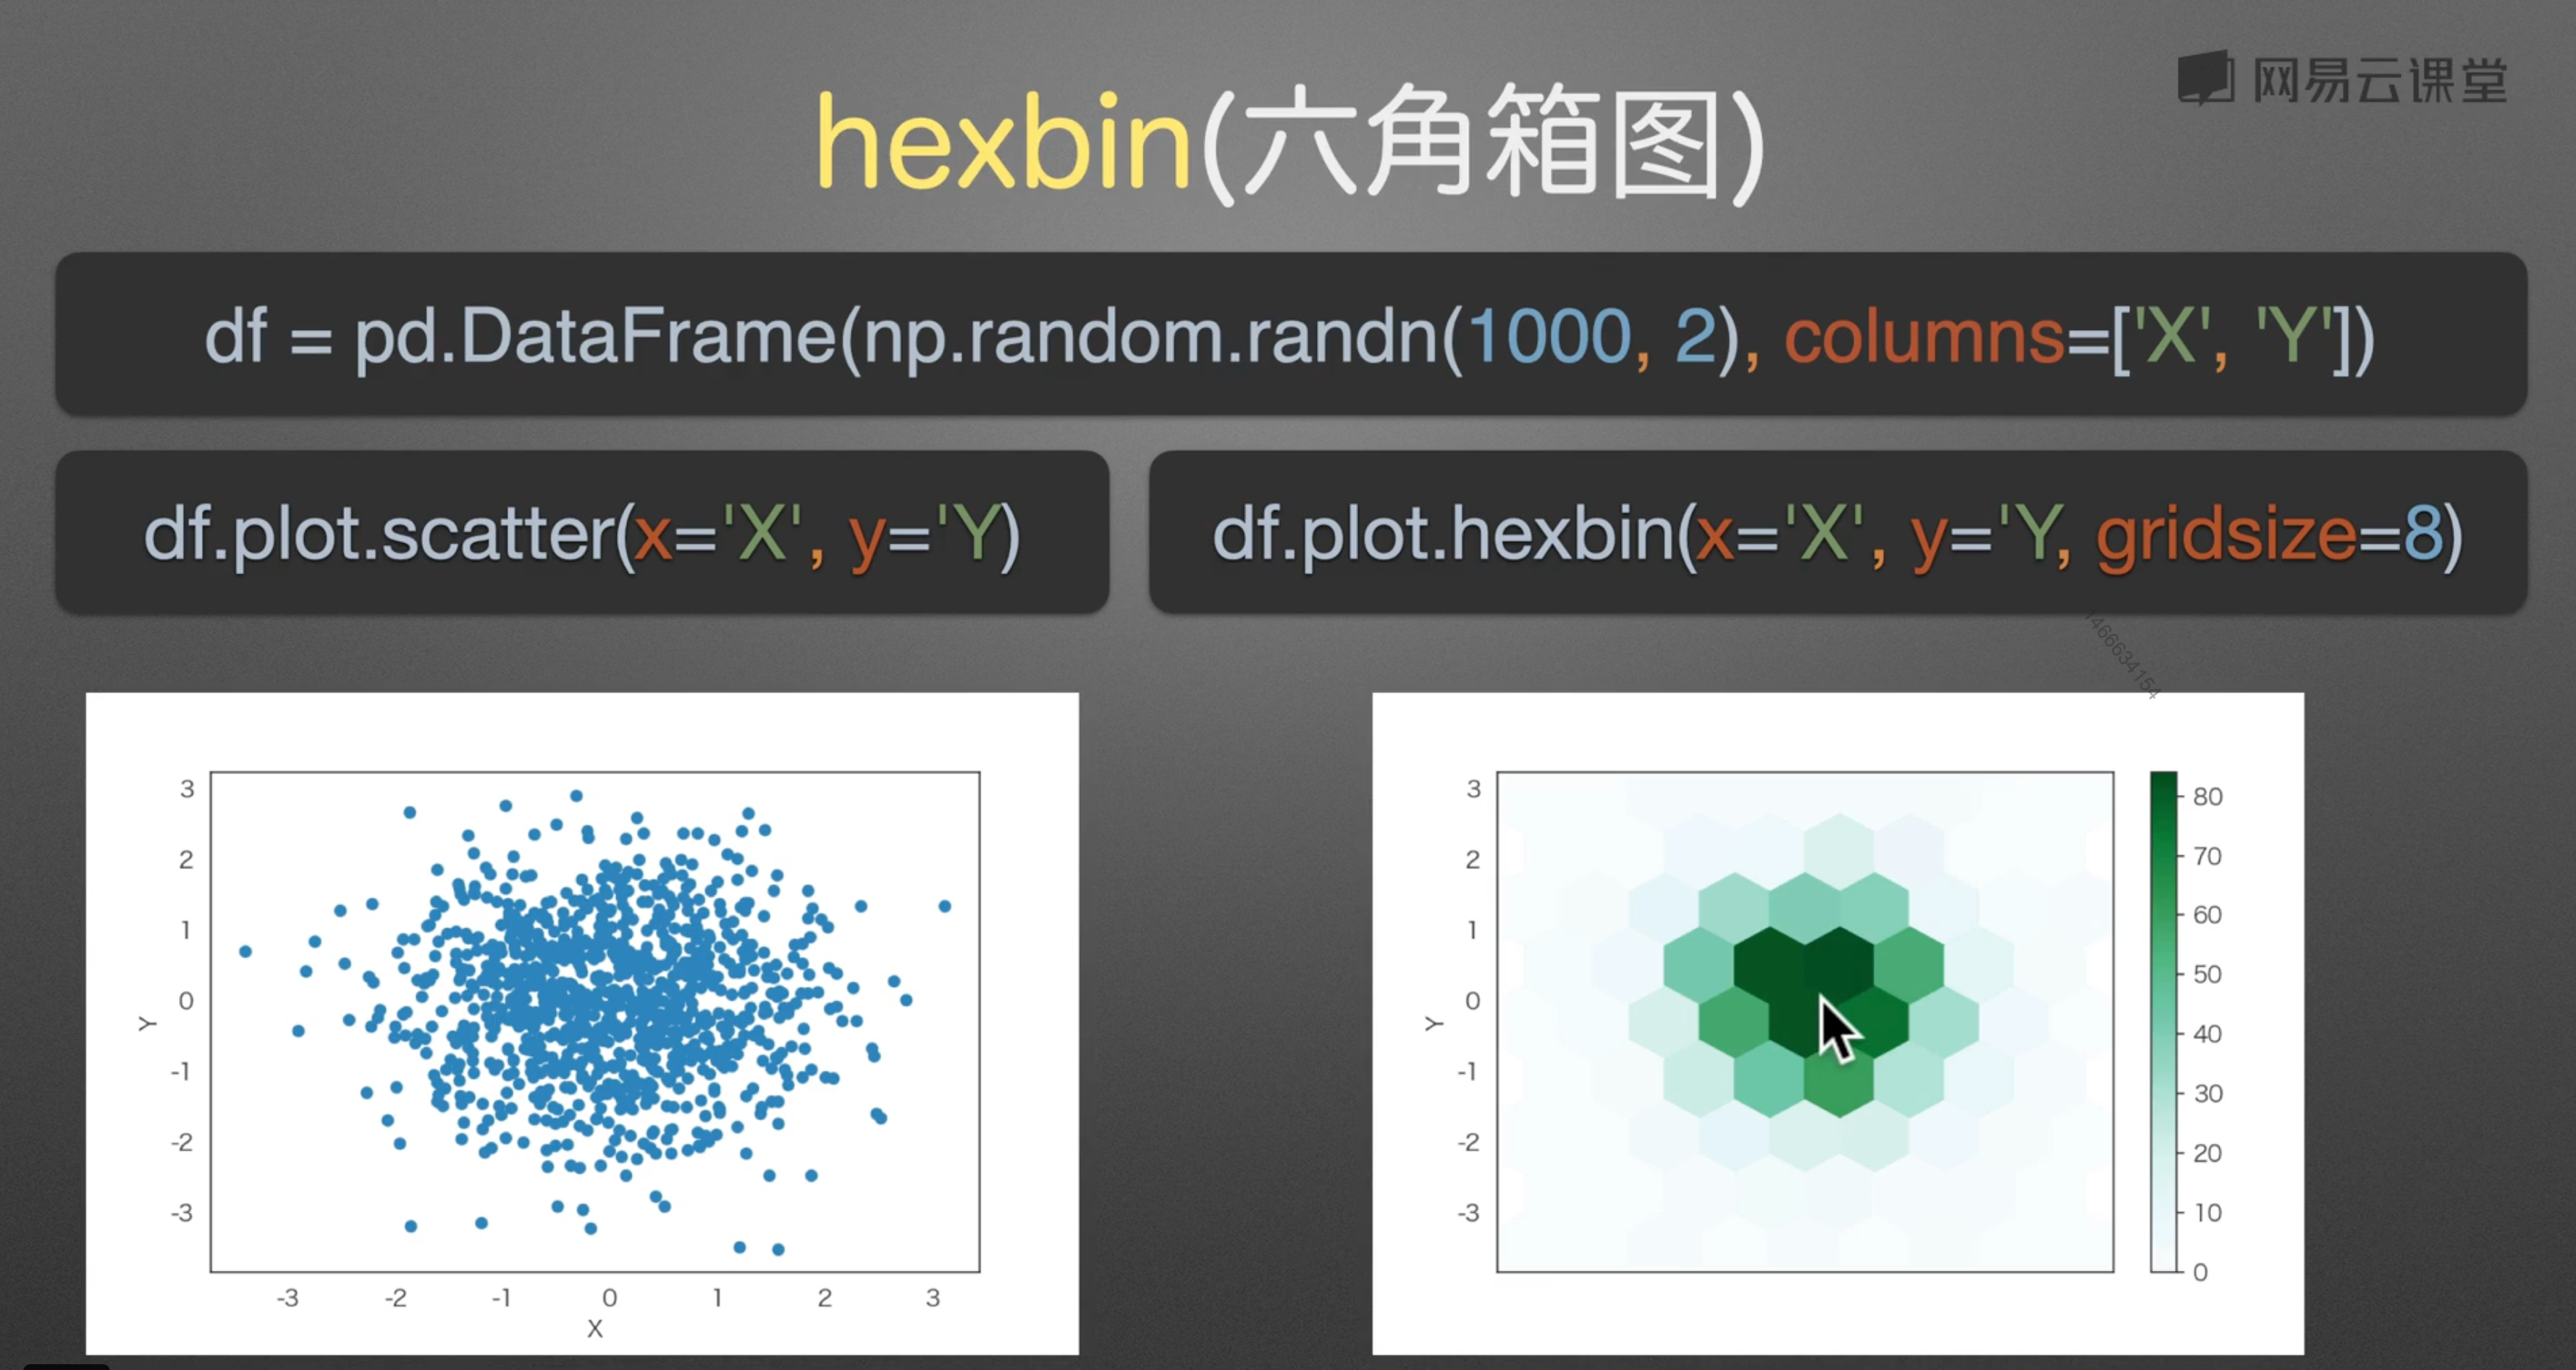
6. 六角箱图
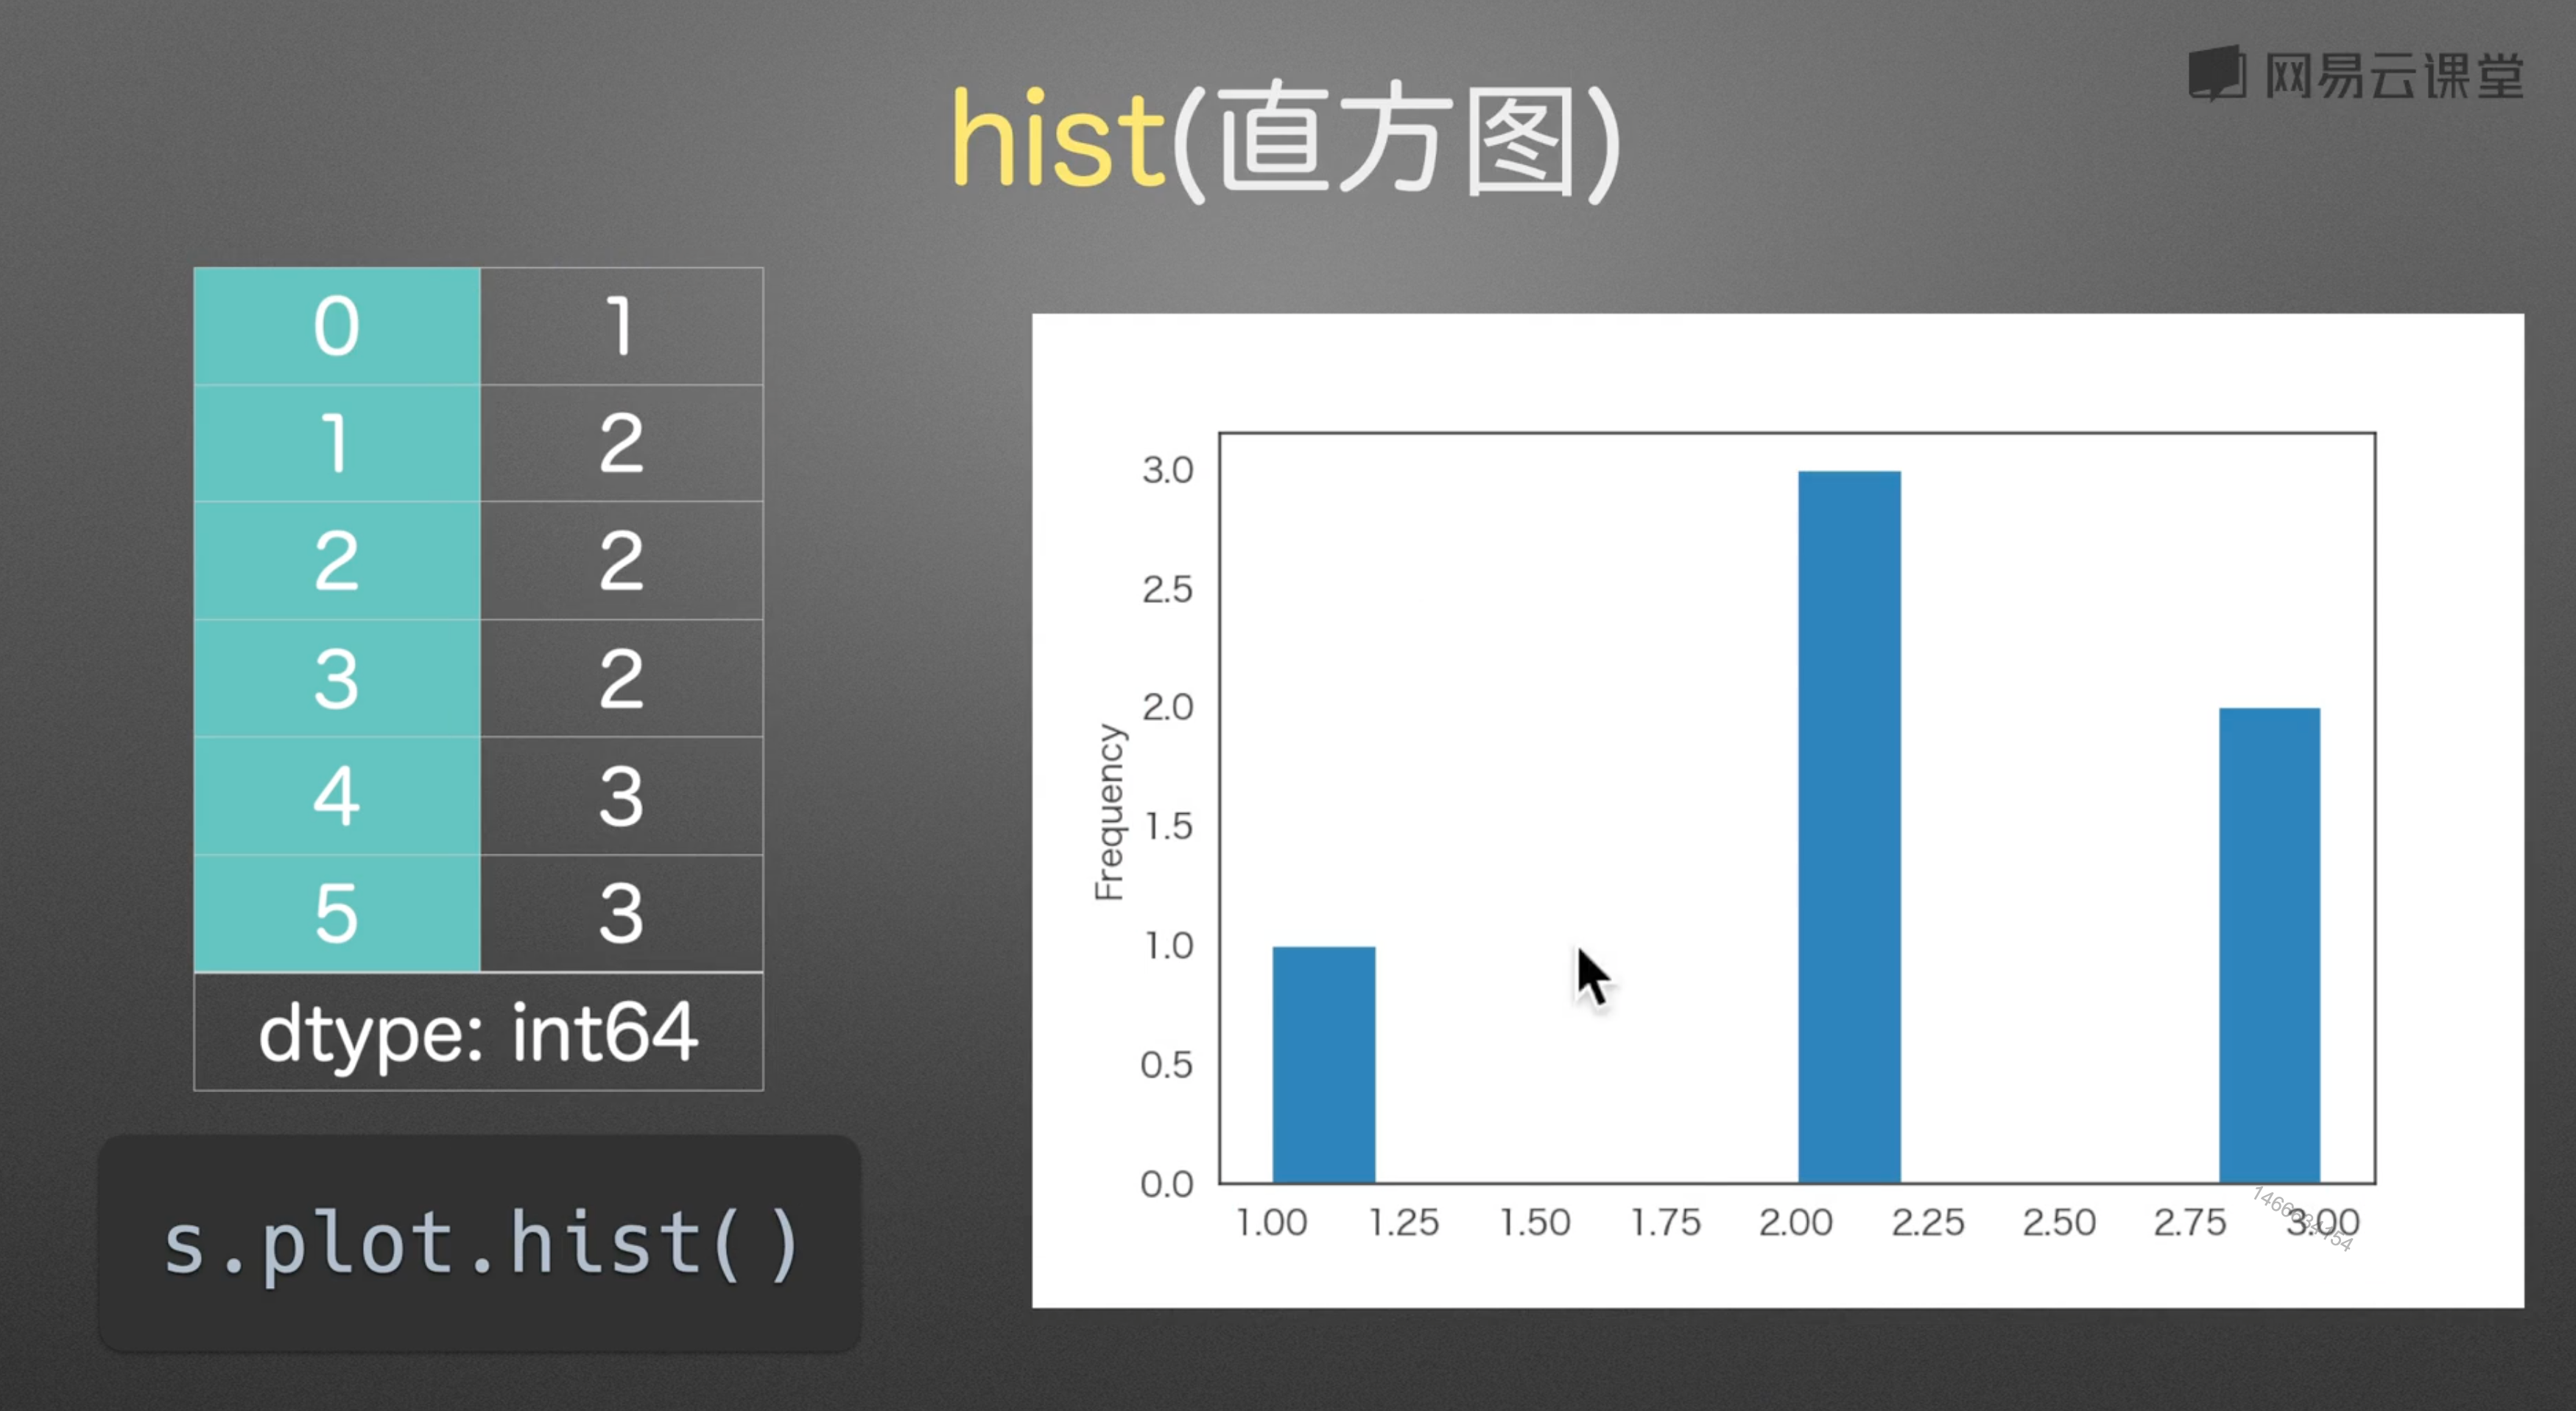
7. 直方图
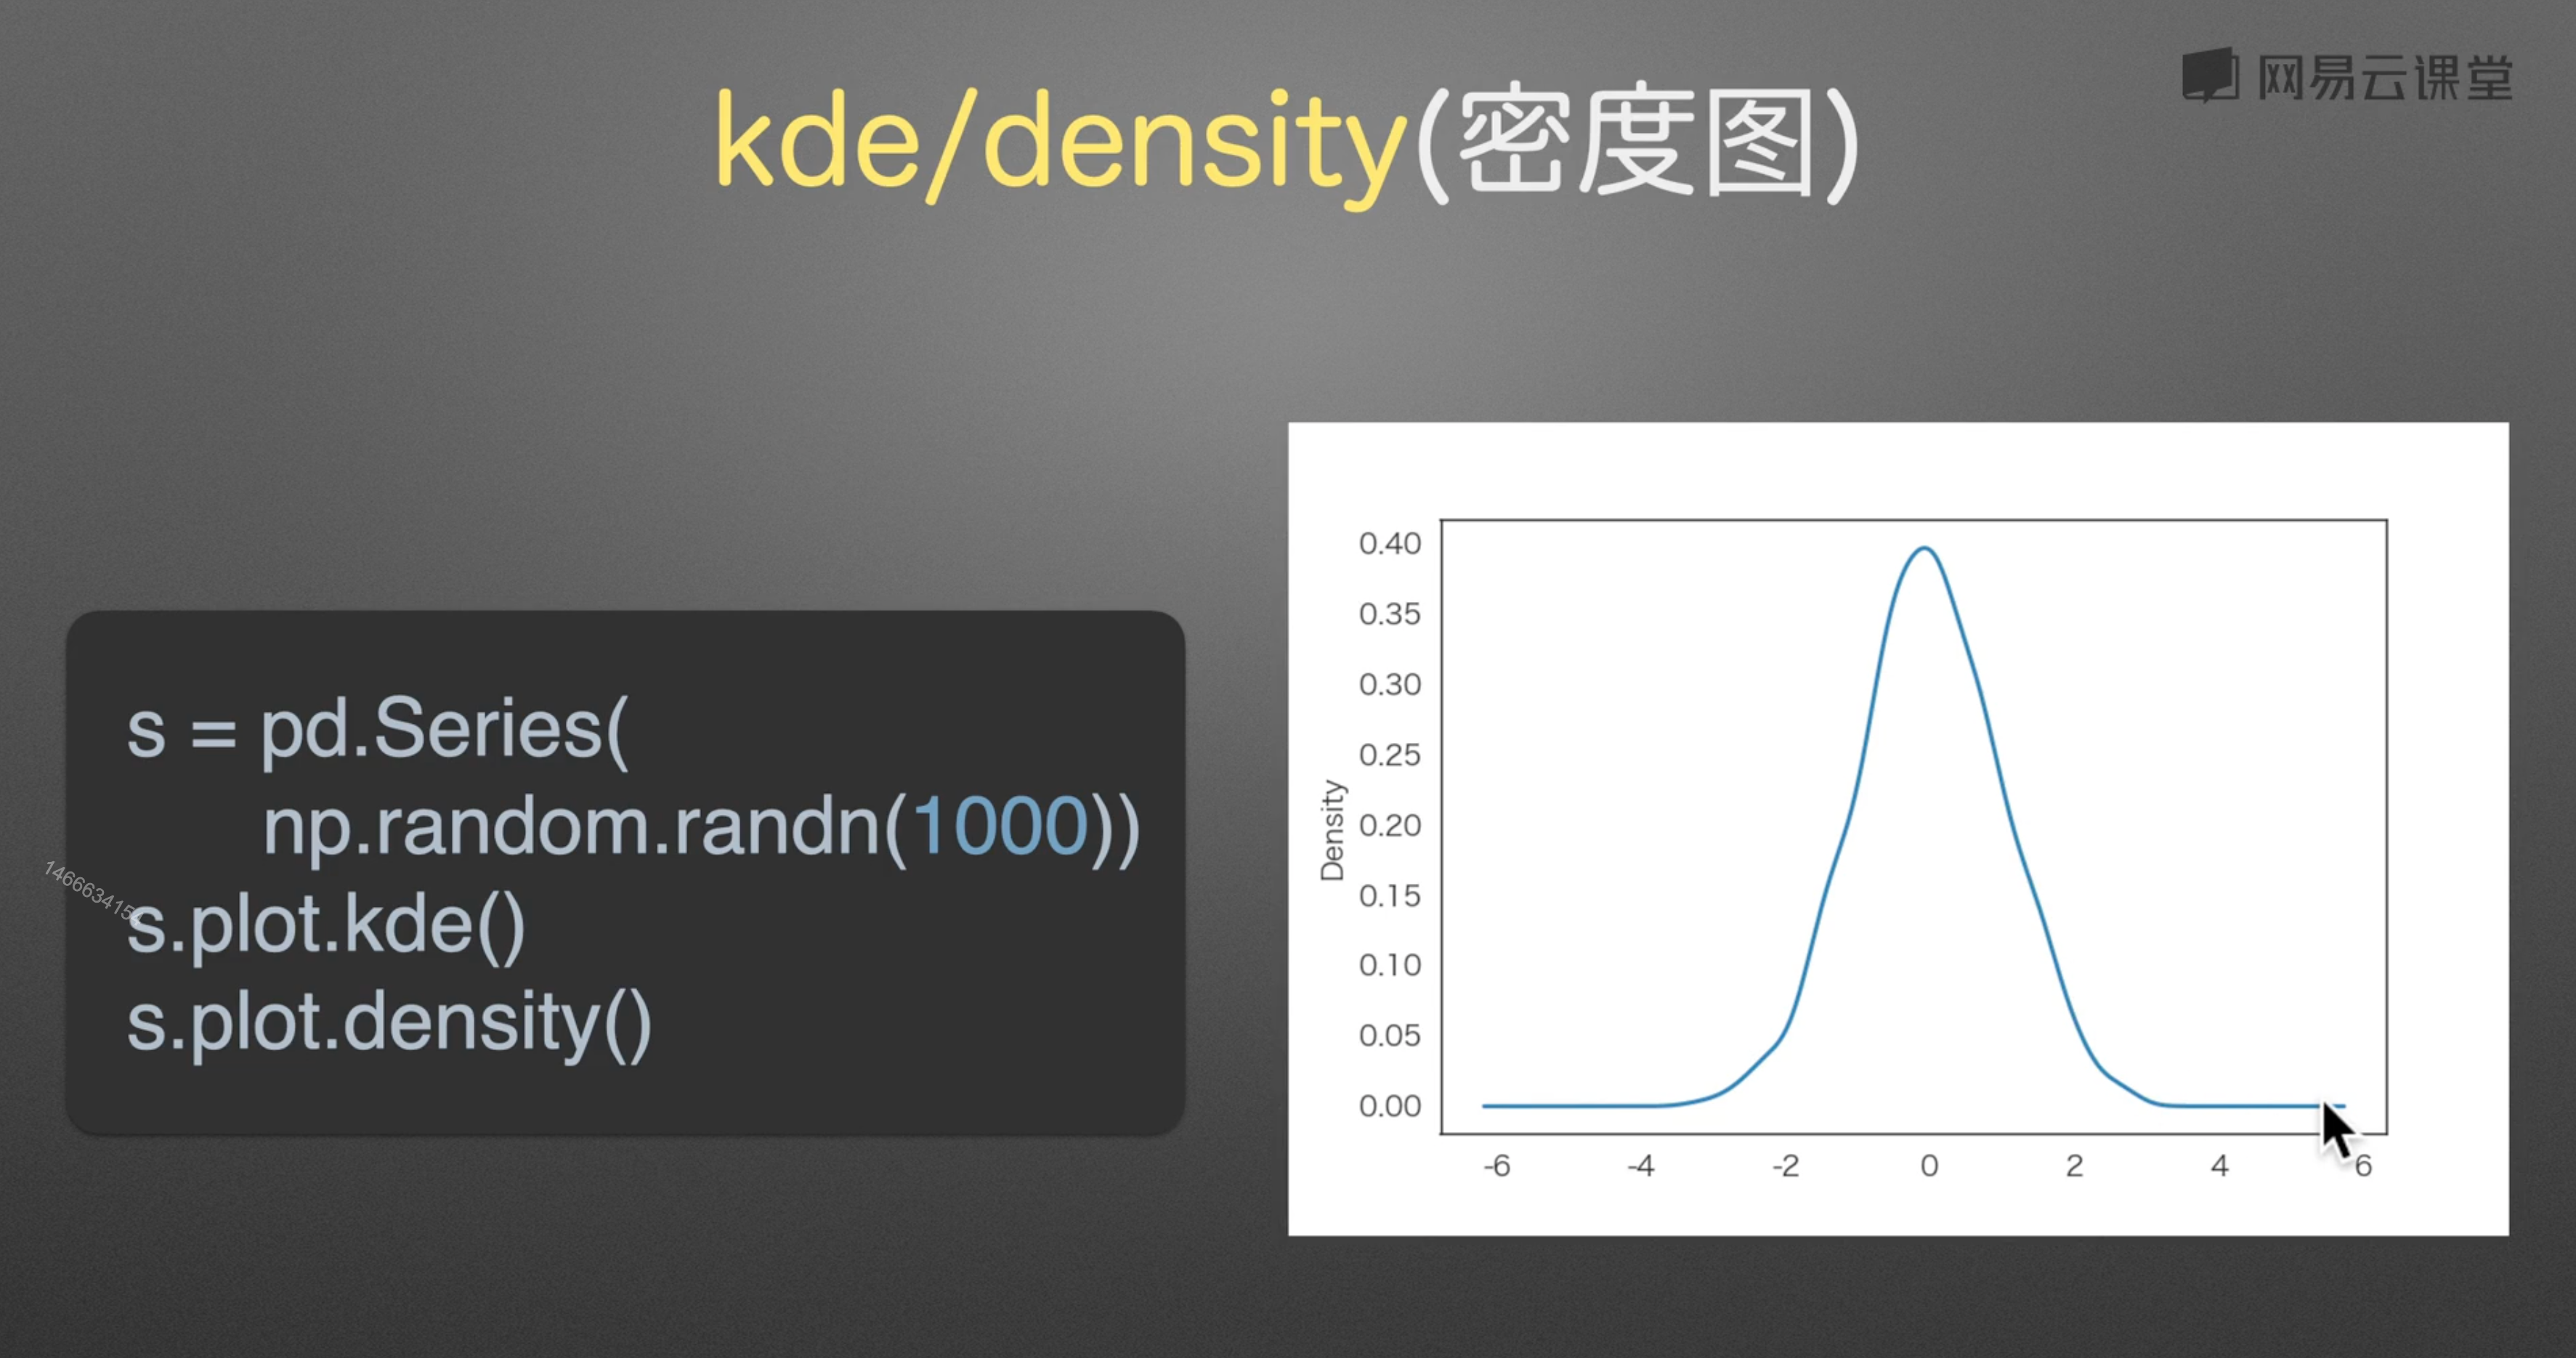
8. 密度图
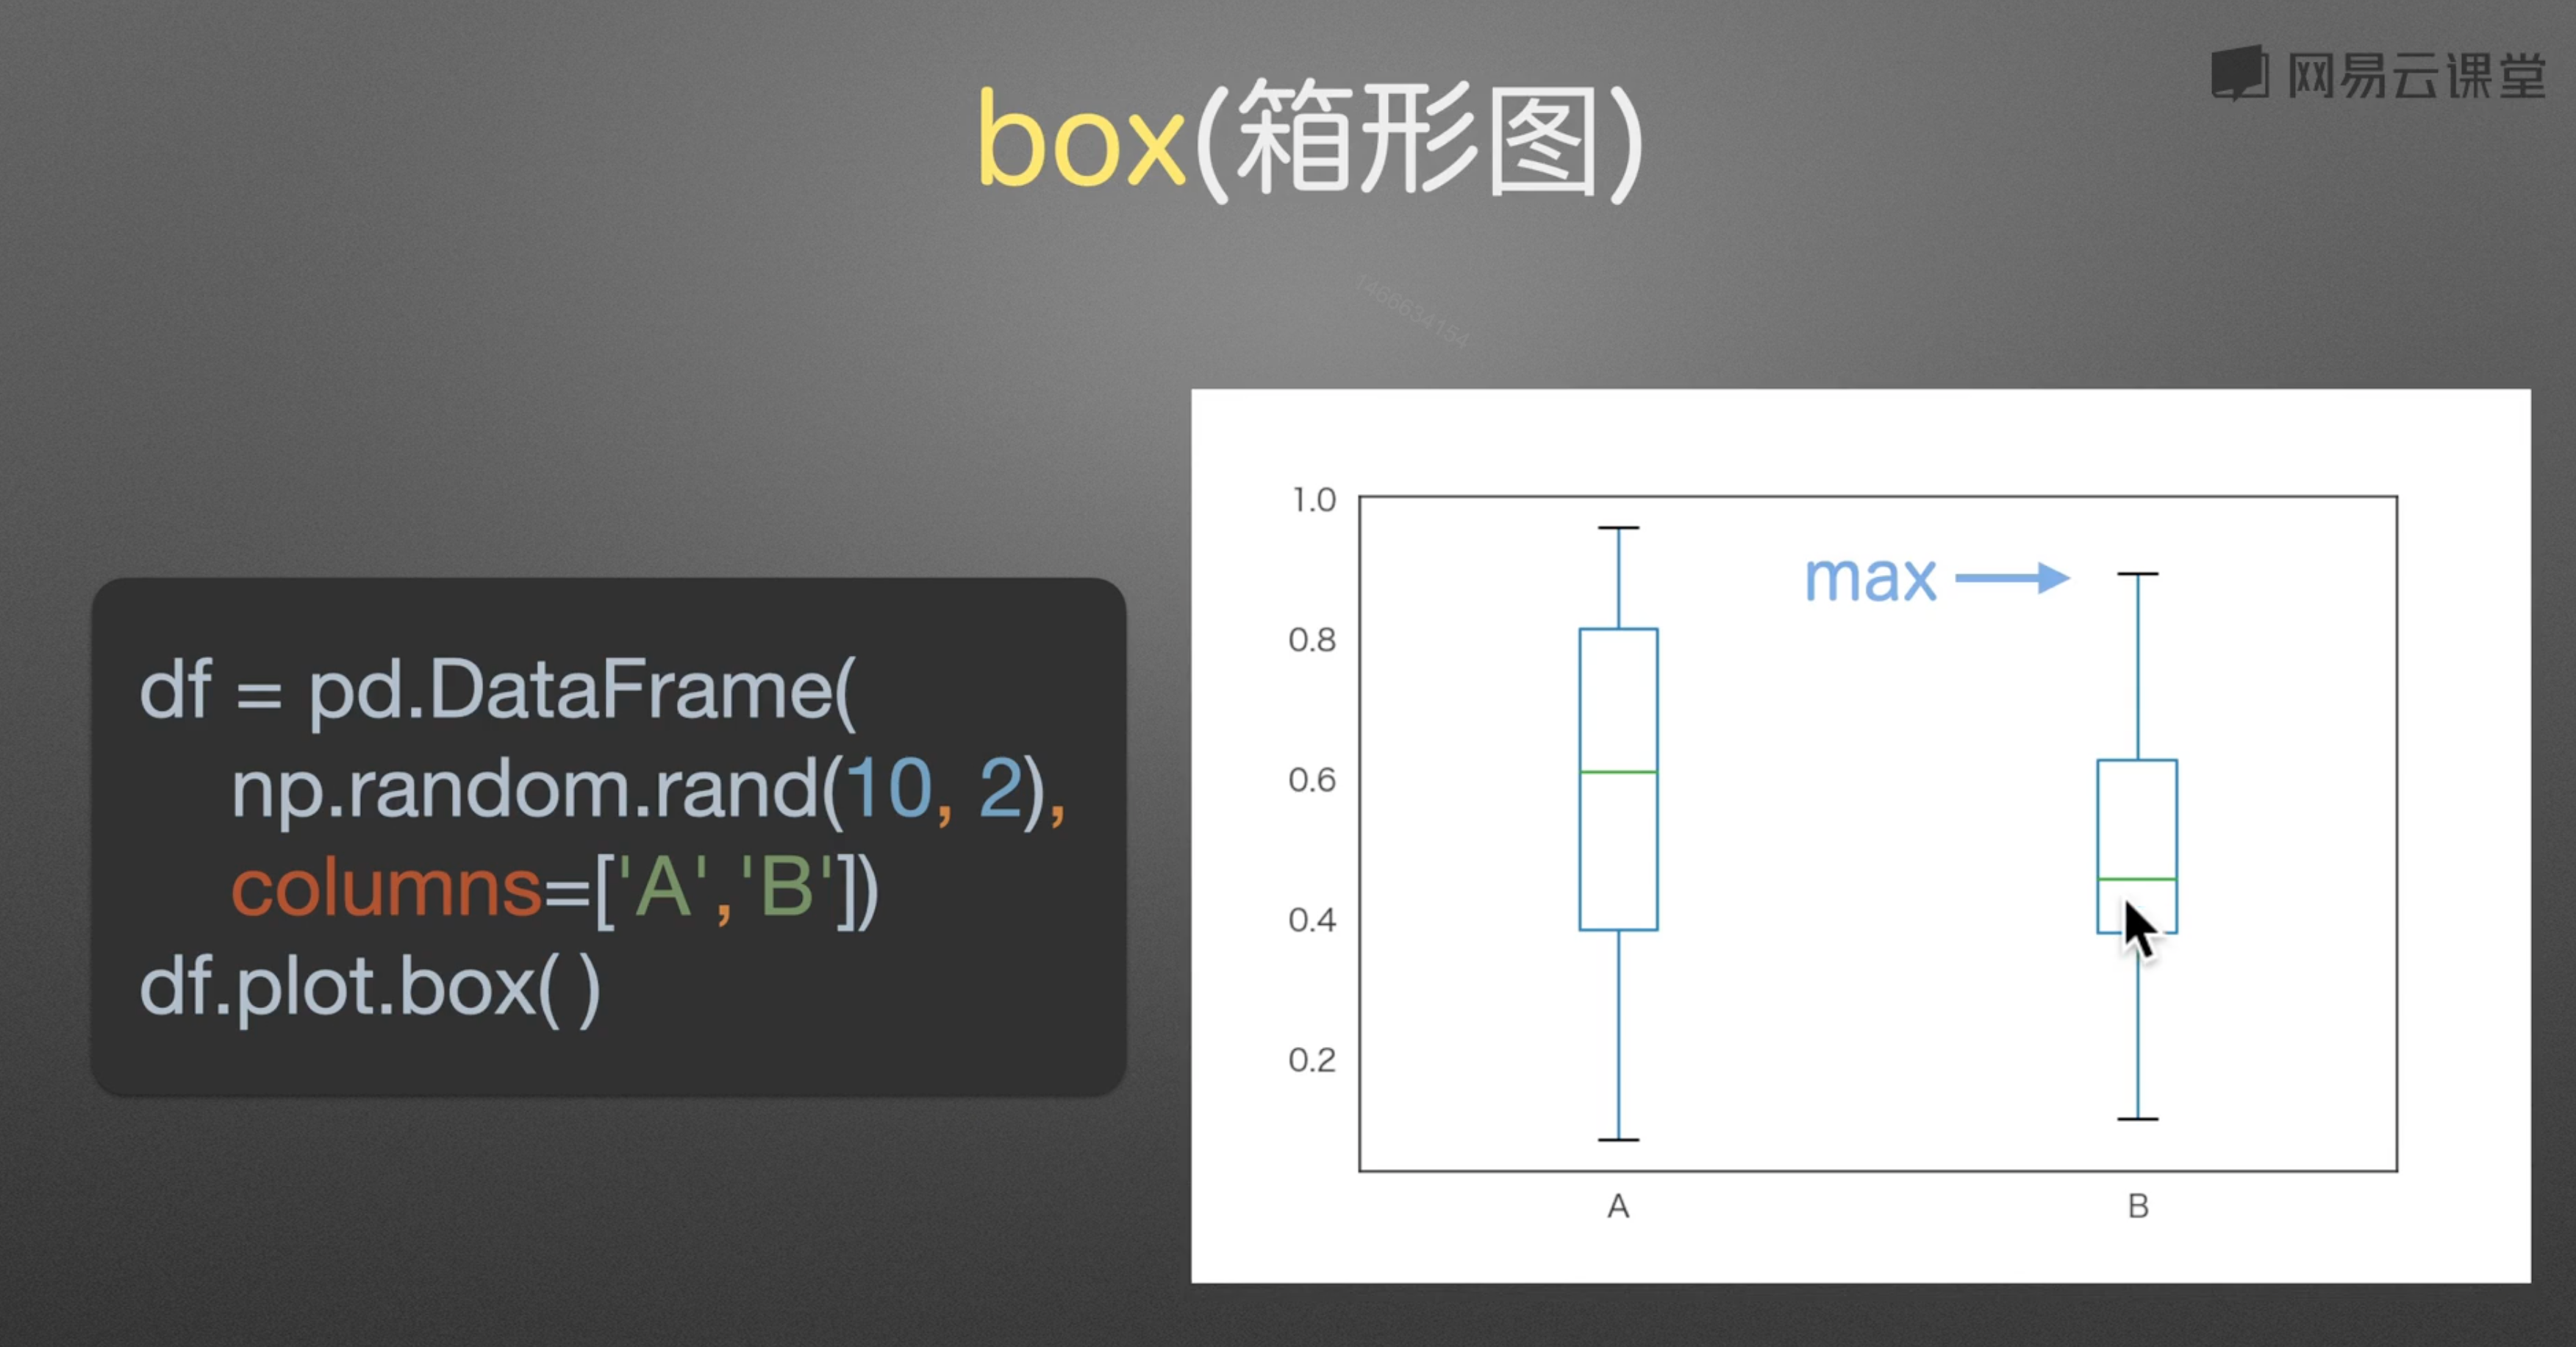
9. 箱形图
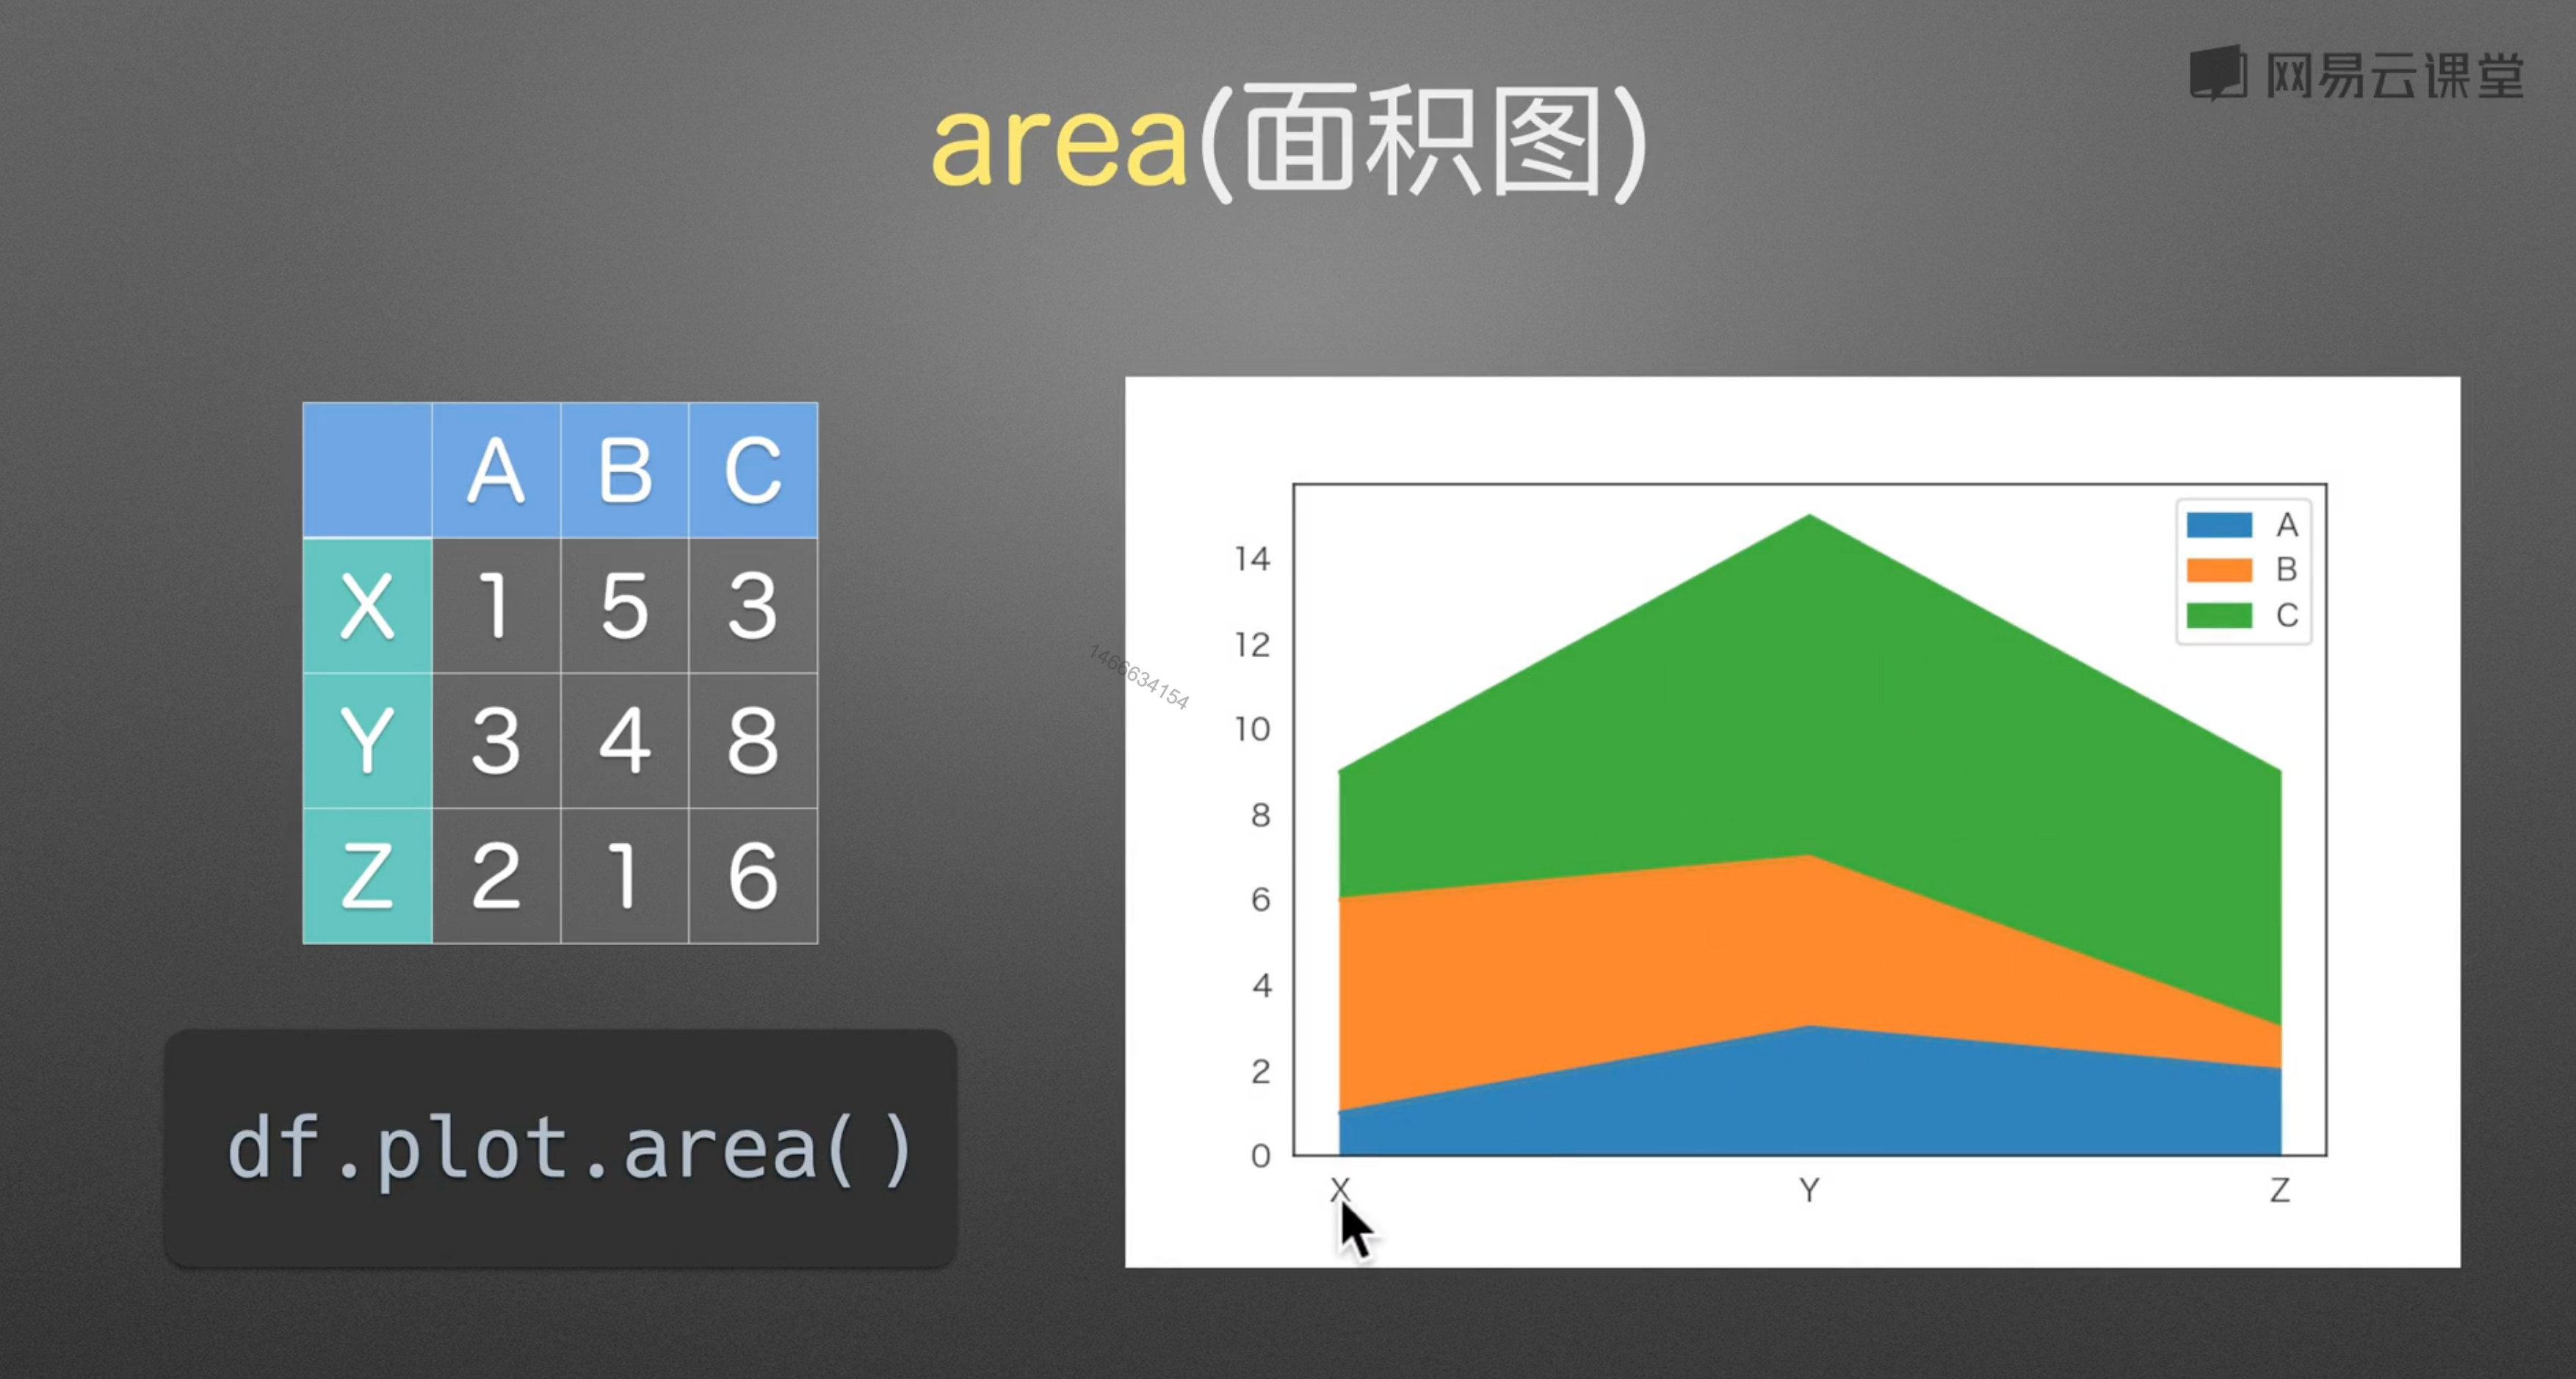
10. 面积图
Matplotlib
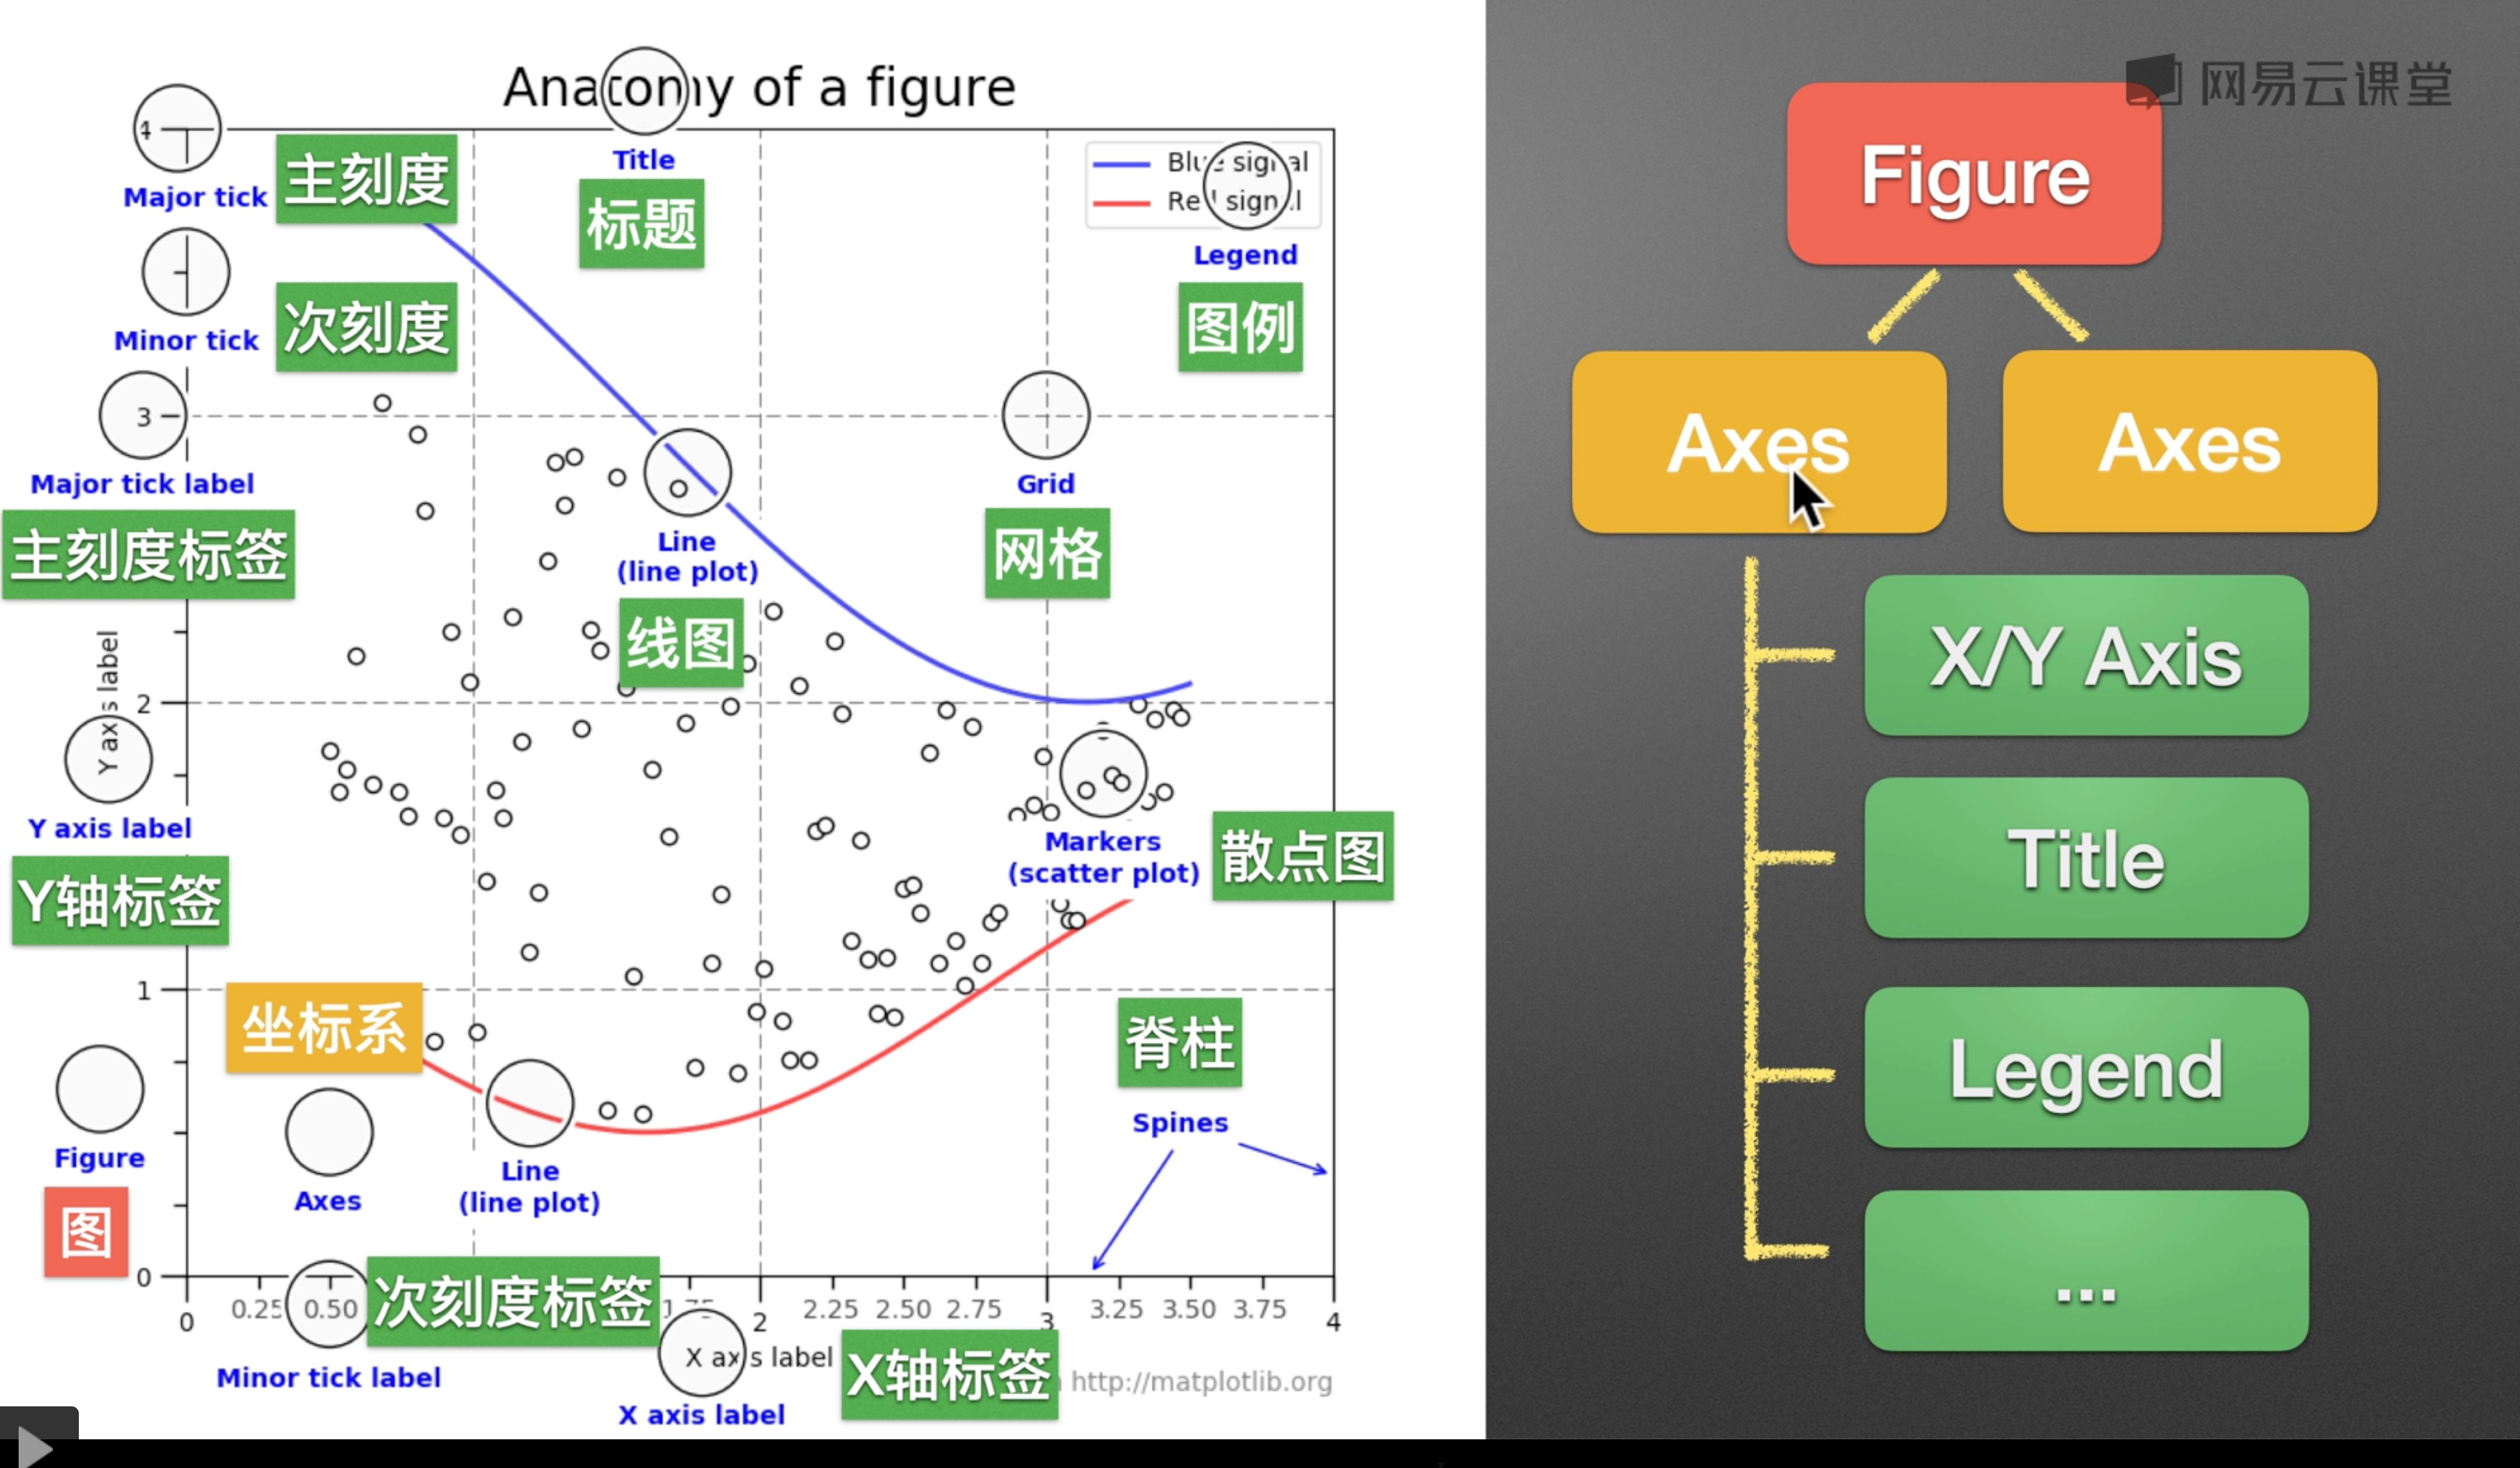
使用matplotlib绘制图片
import pandas as pd
import seaborn as sns
import matplotlib.pyplot as plt

# s = pd.Series(
#     [1, 2, 3],
#     index=list('ABC')
# )
# print(s)
#
# s.plot()

# 创建Df
df = pd.DataFrame({
    "A": [1, 2, 3, 4]
})

df["B"] = df["A"] ** 2
print(df)

# 开始绘图

# 统一建议设置
plt.rcParams['axes.unicode_minus'] = False
# mac 设置中文字体
plt.rcParams['font.sans-serif'] = ['Hiragino Sans GB']
# windows 中文设置
# plt.rcParams['font.sans-serif'] = ['SimHei']

"""
设置样式
facecolor: 更改背景色为白色
figsize: 长宽
dpi: 像素
6*100 6*100
"""
plt.figure(facecolor="white", figsize=(6, 6), dpi=100)

# 创建常见默认x,y
plt.plot(df["A"], df["B"])

"""
设置标题
fontsize: 字体大小
color: 颜色
rotation: 旋转角度
labelpad: 标题与表间隔
"""
plt.title("我是标题", fontsize=30, color='r')
plt.xlabel("X轴", fontsize=24, color='g')
plt.ylabel("Y轴", fontsize=24, color='b', rotation=0, labelpad=15)

# 坐标轴值的区间
plt.xlim([-1, 5])
plt.ylim([0, 20])

# 坐标轴的值 也可以进行样式设置
# plt.xticks([1, 2, 3, 4, 5], fontsize=20)
# plt.yticks([0, 5, 10, 15, 20], fontsize=20)


# major:主刻度 minor:次刻度
# x轴 每个值之间的间距
plt.gca().xaxis.set_major_locator(
    plt.MultipleLocator(2)
)
# x轴 每个值之间刻度标
plt.gca().xaxis.set_minor_locator(
    plt.MultipleLocator(0.5)
)

# y轴 每个值之间的间距
plt.gca().yaxis.set_major_locator(
    plt.MultipleLocator(5)
)
# y轴 每个值之间刻度标
plt.gca().yaxis.set_minor_locator(
    plt.MultipleLocator(1)
)

# 网格展示,加颜色
plt.grid(color='y')

plt.show()
实战
import uuid
import time
import datetime
import traceback
import matplotlib.pyplot as plt

# 关闭交互模式
plt.switch_backend('Agg')
# 关闭告警
plt.set_loglevel('WARNING')


def data_2_line_chart(x, y, label, event_time):
    """
    将数据绘制为折线图

    :param: x 轴数据
    :param: y 轴数据
    :param: label 指标 e.g. test11
    :param: event_time 活动时间 e.g. {'start_time': 66666666666, 'end_time': 755555555555}
    :return: image_path + name
    """
    name = uuid.uuid4()
    path = f'{name}.png'
    # 背景:白色,大小:2500*600
    fig, ax = plt.subplots(facecolor="white", figsize=(25, 6), dpi=100)
    # 去除上左右边框
    ax.spines['top'].set_color('none')
    ax.spines['left'].set_color('none')
    ax.spines['right'].set_color('none')
    # 绘制,加实心·
    ax.plot(x, y, marker='o')
    # 填充指定区间
    x_fill = [i for i in x if event_time["start_time"] > i > event_time["end_time"]]
    ax.fill_between(x_fill, 0, max(y), alpha=0.3, facecolor='r')
    # y轴数据
    # ax.set_ylim([0, max(MetricValue)])
    #  设置就在 y 轴方向显示网格线
    ax.grid(axis='y', color='gray', linestyle='--')
    # 指标
    ax.legend(frameon=False, labels=[label], bbox_to_anchor=(0, 1.02), loc=3, borderaxespad=0)
    # x轴,每个值之间1个刻度
    ax.xaxis.set_minor_locator(
        plt.MultipleLocator(1)
    )
    # x轴,每8个值展示
    ax.xaxis.set_major_locator(
        plt.MultipleLocator(8)
    )
    # 保存图片
    ax.figure.savefig(path)
    plt.close(fig)
    return path
觉得文章写的不错,可以请喝杯咖啡
- Post link: https://yanxiang.wang/%E6%95%B0%E6%8D%AE%E5%8F%AF%E8%A7%86%E5%8C%96/
- Copyright Notice: All articles in this blog are licensed under unless otherwise stated.


